 is obtained by calculating the Feynman diagrams shown in
Fig.(7).
In conventional VMD models, the amplitude for the process  is obtained by calculating the Feynman diagrams shown in
Fig.(7).

Figure 7: Feynman diagrams for the process  from Vector Meson contributions
All the couplings of our amplitudes can be deduced from the two previously
presented
lagrangians, eqs. (36,71), with  .
In addition to the
  couplings (38),
which satisfactorily describe the set of data
for
  , for processes like
  , where
 or
or  , one
needs to introduce a small contamination
  of non-strange quarks in
the
  meson.
The relative amount can be deduced from the experimental [13]
decay width
  =5.8
=5.8 0.6 KeV, which can
be reproduced by VMD with
where the sign comes from observed  interference effects in
 [13].
[13].
With our lagrangians and the
quoted values for the coupling constants, let us now turn to
predict the intermediate vector-meson contributions to
 .
>From the kinematical point of view these processes involve the two
following amplitudes
where  are the polarizations of the final photon
(initial vector meson), and q (
 ) are the corresponding
four-momenta;
P=p+q,
  are
those for the virtual (intermediate) vector mesons (V
and
  ) of the direct and crossed terms (see Fig.(7)). The total VMD
amplitude is then found to be
where
 is the
  coupling constant
and
  is the decaying vector meson. The intermediate ones, V and
  ,
can be either the
  or the
  -mesons, with
 in
in  and
and  in
in  -decays; for
 one obviously has
  and
and
 . The
coefficient C is the same for both terms (using SU(3)-symmetric couplings)
and changes from process to process according to well-known quark-model or
nonet-symmetry rules:

and
for the  -decays where the Zweig-rule is operative.
>From the above amplitudes, the partial widths are obtained performing a numerical integration of
where the factor (1/2) has to be included only for  decays.
Our results using the full VMD amplitudes (51)
and the three-body phase space formulae (54) are shown in the two last
columns of Table 1. For comparison we
also include (first column) the upper limit for the three experimentally
studied decay rates [13,20] and the predictions of other authors
[22,23,24] who have worked in our same context. Our
results are not incompatible with those by Singer [25], who first
noticed
the simple relation  for the VMD part of the rate. This relation allows for a
comparison of our results with those by Renard [23], quoted
(in parenthesis) in the second column of Table 1. The accompanying
values are
the original ones [23] corrected by the present-day data for
 and
and  , and turn out to be in excellent agreement with
our predictions. The agreement with ref.[24] is somewhat less
satisfactory. Finally, we disagree in the complete list of numerical
predictions quoted in ref.[22] even if the initial expressions for
the lagrangians are the same, since that our coupling constant g has been
defined as
  of that in ref.[22].

Table 1:
Global contribution of intermediate vector mesons to
decay rates (in eV) and branching ratios (last column) for different  transitions as predicted by several authors. Experimental upper
limits are also quoted.
Notice that the branching ratios (BR) appearing in the last column of Table 1, do not always coincide with the simple product of branching ratios for the individual vector dominated diagrams of Fig.(7). This point has been discussed in detail in ref.[26]
Concentrating on  -decays one first observes that our vector-meson
dominated mechanism predicts a completely negligible
  , contrasting with the four orders of magnitude larger prediction
from ref.[22]. We have carefully analyzed our calculation and, for
this channel containing exclusively soft photons (
 MeV), an
analytic
expression for the amplitude in this low-E limit has been obtained. One has

where p,  are the pseudoscalar four-momenta, and

accidentally containing the small numerical factor
 [13]. In
other words, the
  decay
is predicted to be exceptionally suppressed not only by the obviously scarce
available phase-space but also due to an almost complete destructive
interference
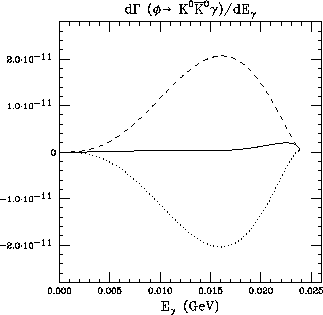
in the amplitude, as explicitly shown in Fig.(8).
(Reversing the sign of the
interference term would enlarge the width by 2 orders of magnitude).

Figure 8: Photonic spectrum generated by intermediate vector-mesons in
 (solid line). Dashed and dotted lines correspond
to twice the contribution of a single diagram and their interference,
respectively.
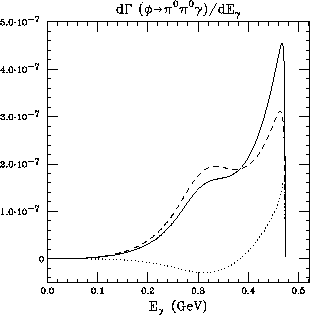
Our mechanism also predicts sizable contributions to
 and
and  decays. The corresponding
photonic spectra are shown in Figs.(9) and
(10), where the interference effects
have again been separated.

Figure 9: Photonic spectrum in  with conventions
as in Fig.(8).

Figure 10: Photonic spectrum in  . Dashed and
dot-dashed lines are the contributions of each diagram and the dotted
line corresponds to their interference.
These interference effects contribute to enhance the peak at high
E in the  spectrum. Roughly one-half of this
decay contains a photon with an energy E in the narrow range 400 MeV
 MeV. Alternative
mechanisms, such as
  are expected to produce exclusively lower energy photons,
thus minimizing the interferences and allowing for separated analyses,
particularly in
  .
We also notice that our predictions for this (and
  ) decay include events with the
  and
and  invariant mass on the
  -peak. As discussed in [26] for
the case of
  , our calculation implicitly
contains simpler estimates in terms of two-body branching
ratios. The latter imply [13]
 and
and
 =
=
 , only in marginal agreement with our
tabulated results because important interference and off-mass-shell
effects have been neglected. We believe that our calculation should
be prefered to these simpler estimate.
However, these rough estimates are useful and
allow for a numerical check of our predictions. Indeed, by artificially
reducing the
  -width in our complete (three-body) calculation one
recovers the expected agreement with the above simpler (two-body) estimates
discussed at the end of section 3 of [26].