LARES
The work reported in this section has been performed by INFN-LNF at the end of 2008, when ASI requested to perform an industrial acceptance test of all the 110 CCRs of the LARES satellite. LARES is a passive tungsten sphere satellite of about 18cm radius, covered with 92 CCRs made of fused silica. It orbits at a nearly circular orbit with semi-major axis of about 7900 Km. The CCRs used for the satellite were manufactured by ZEISS, but in order to asses the compliance with their optical specification ASI requested INFN-LNF to do FFDP measurements of those CCRs. Specifications of LARES CCRs were: front face aperture of 1.5”, DAOs = ( 1.5 ± 0.5) arcsec. We performed FFDP measurements at the SCF, in air at room temperature, in 3 working weeks before Christmas 2008, on a red laser optical table (He-Ne, λ = 632.8 nm).
LARES retroreflectors acceptance test
In order to define a criterium of acceptance for the CCRs, we referred to the shape of the FFDP of an uncoated CCR with front face aperture of 1.5” and DAOs as specified before, oriented with a vertical physical edge and an horizontally polarized beam. The FFDP has a very distinctive shape with two peaks distributed horizontally, symmetric with respect to the center. Therefore compared the distances between those peaks and their intensities with measurements. Simulations (peaks distances and intensities), defined a band, in red in Fig. , in which measured values should be delimited. In Fig. 1, 2, 3, 4 we present the results of the tests on all of the 4 lots in which the 110 CCRs were divided. This work was approved by ASI and the PI and retroreflectors were accepted by ASI and the PI with reference document: DC-OSU-2009-012.
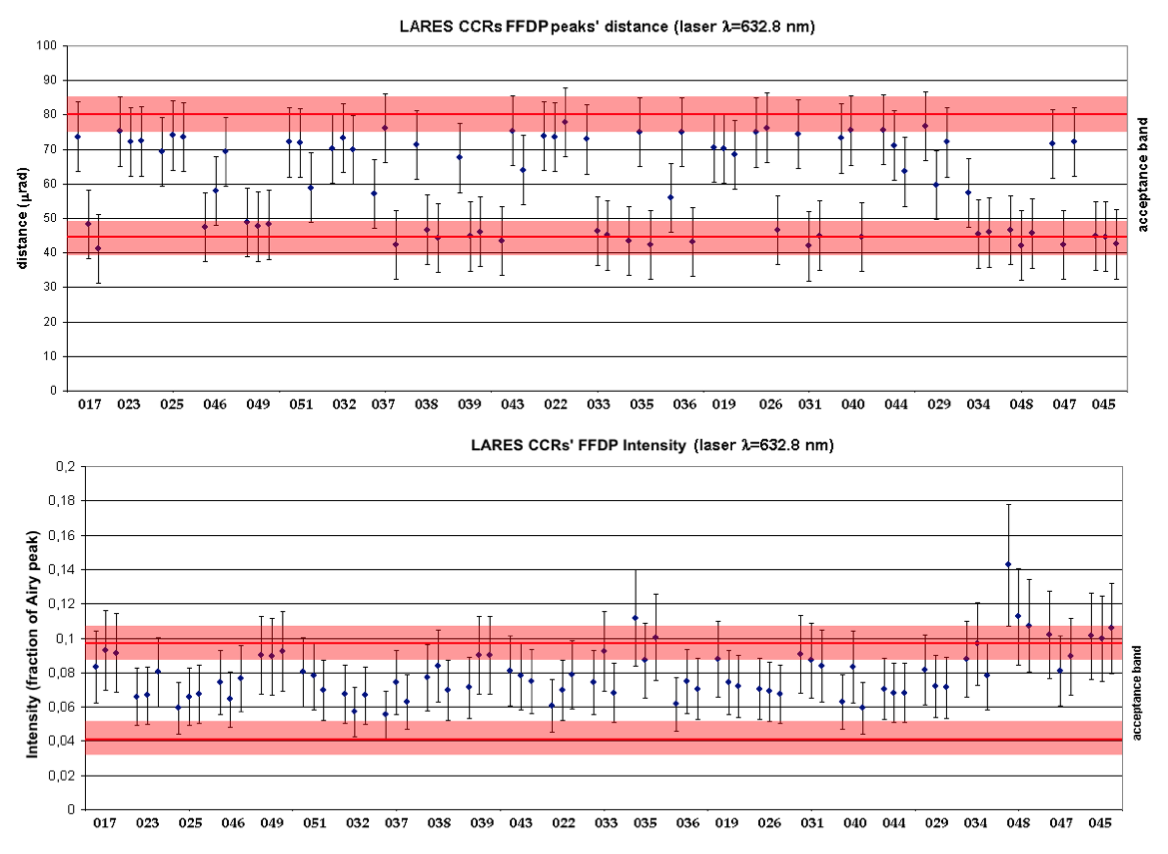
Figure 1: Distance (Top) and intensity (Bottom) plots for LARES CCRs lot 1. Error on measured peaks distance is ±10 μrad. Error on measured intensity is ±25% relative
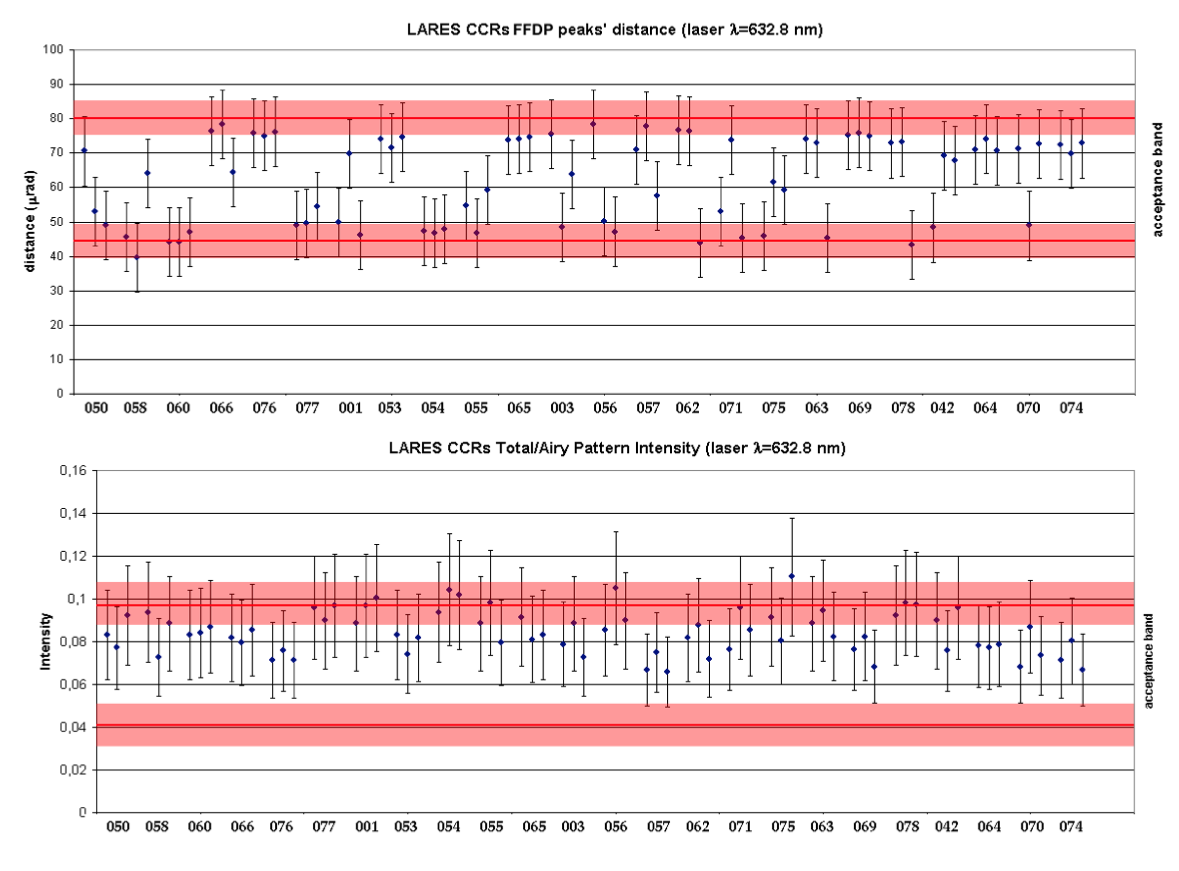
Figure 2: Distance (Top) and intensity (Bottom) plots for LARES CCRs lot 2. Error on measured peaks distance is ±10 μrad. Error on measured intensity is ±25% relative
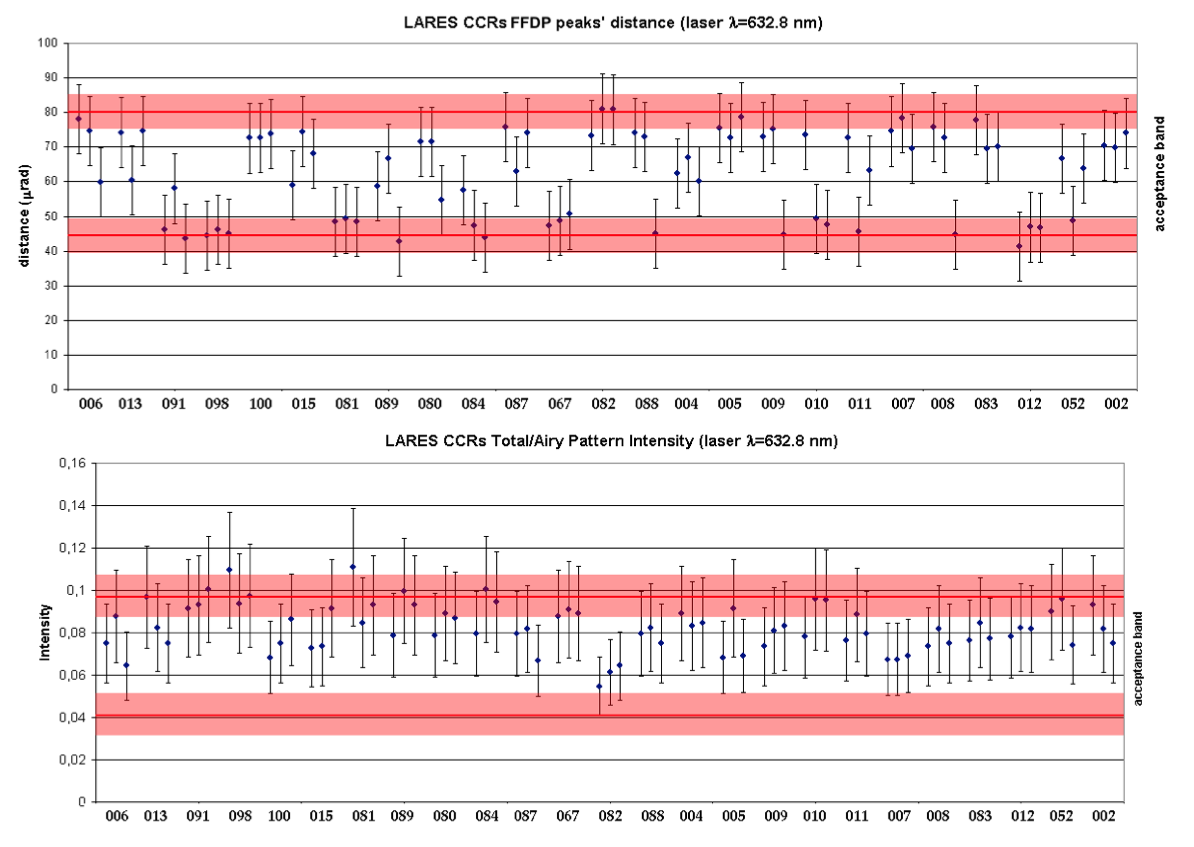
Figure 3: Distance (Top) and intensity (Bottom) plots for LARES CCRs lot 3. Error on measured peaks distance is ±10 μrad. Error on measured intensity is ±25% relative
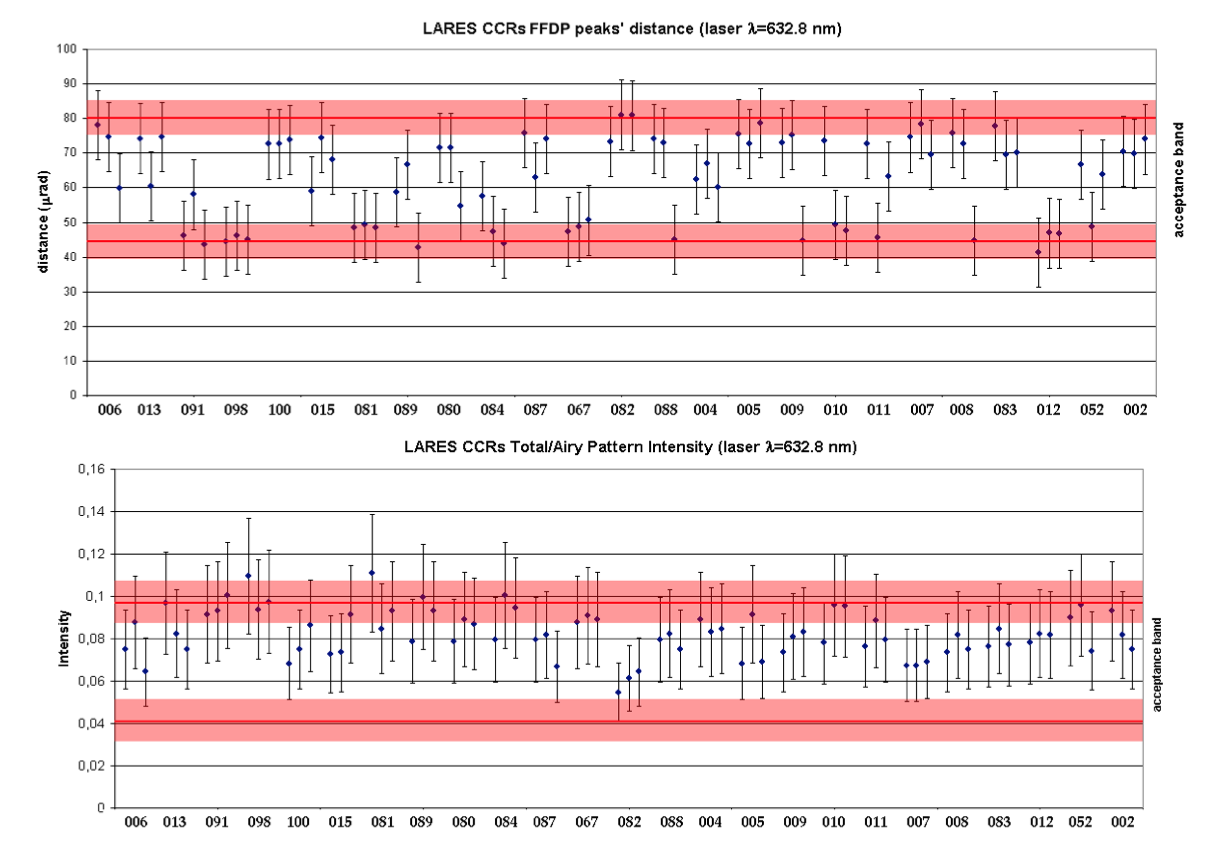
Figure 4: Distance (Top) and intensity (Bottom) plots for LARES CCRs lot 4. Error on measured peaks distance is ±10 μrad. Error on measured intensity is ±25% relative