Threshold Scan Results
Threshold scan results have been analyzed with an automated software.
Results shown in this web page have been obtained with the following procedure:
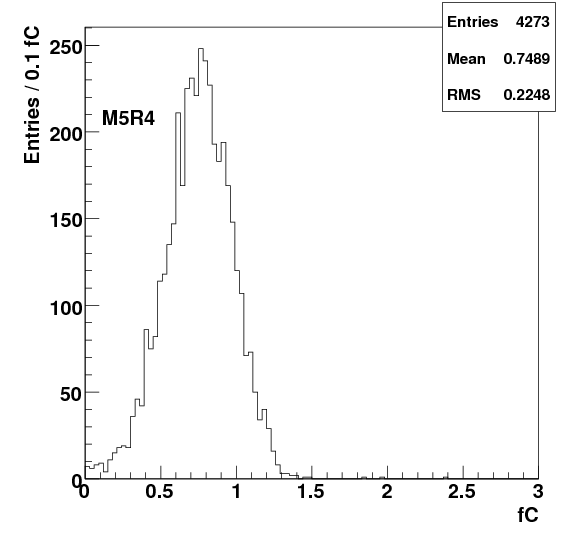
- The right half of the spectrum is fitted with an exponential: here ((png) and (eps)) are some sample fits (16 channels of 1 M5R4 FEB)
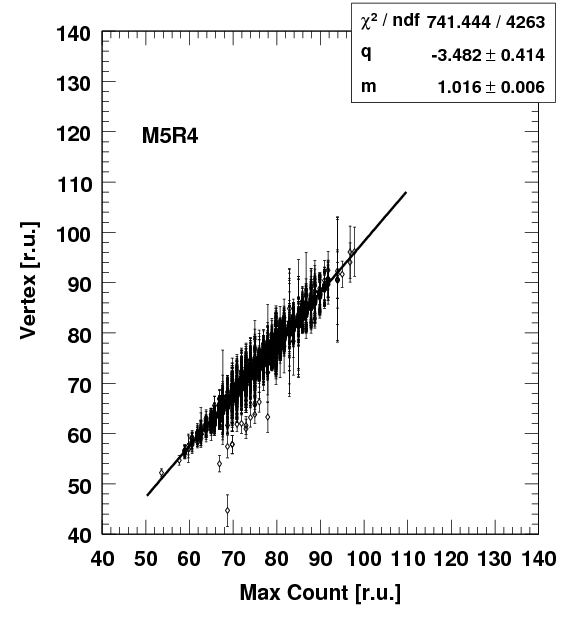
- The parameters are used to extract the slope (m) and intercept (q) values of the linearized distribution.
- m and q are used to compute (a) the x at which we have y = 0 (x_large) and (b) the x at which the rate is equal to 25 MHz (x_small).
- The differences btw (a) and (b) are computed as follows: diff = sqrt(a) - sqrt (b)
- Diff is converted in mV using the relation: mV = r.u.*2.35
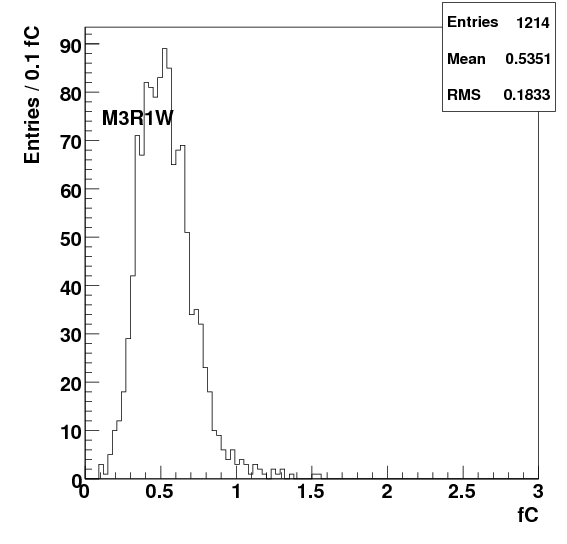
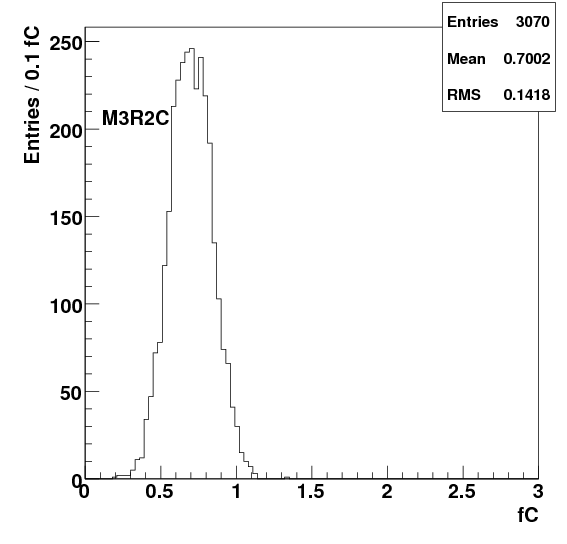
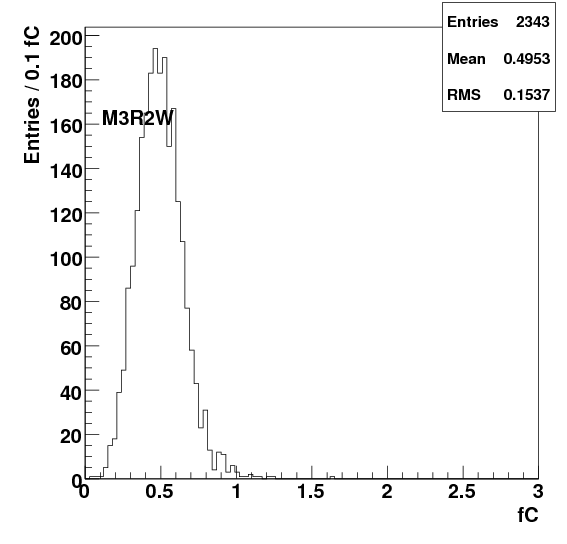
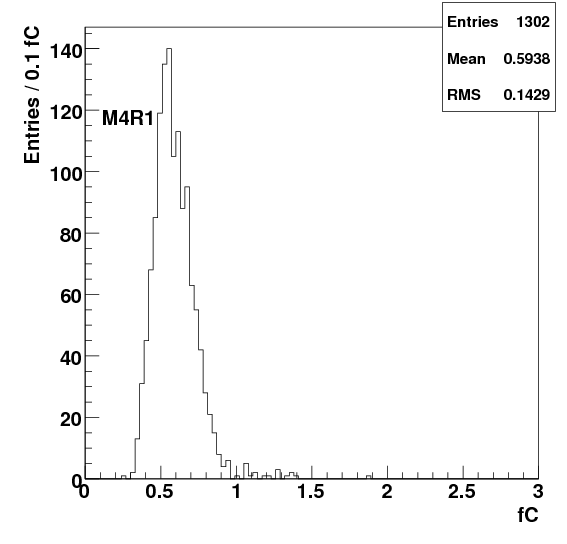
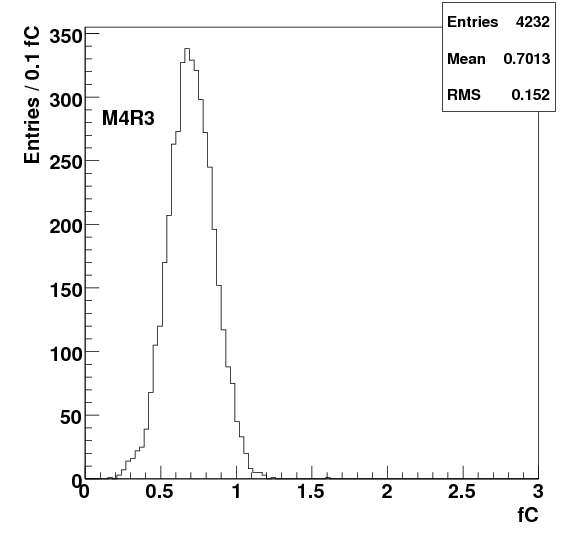
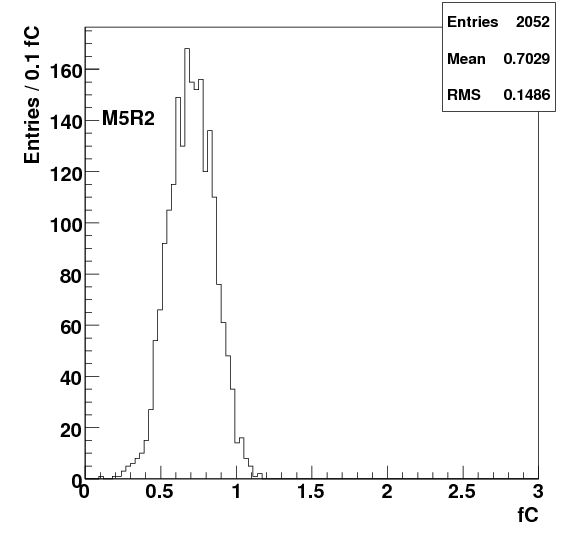
- Diff_mv is then converted in fC by using the sensitivity: Diff_fC = Diff_mV/sensitivity. The values used for sensitivity are shown in table 1.
Table 1. Sensitivities used for the study
| M1 | M2 | M3 | M4 | M5 |
|---|
| Region | Sensitivity (mV) | Region | Sensitivity (mV) | Region | Sensitivity (mV) | Region | Sensitivity (mV) | Region | Sensitivity (mV) |
|---|
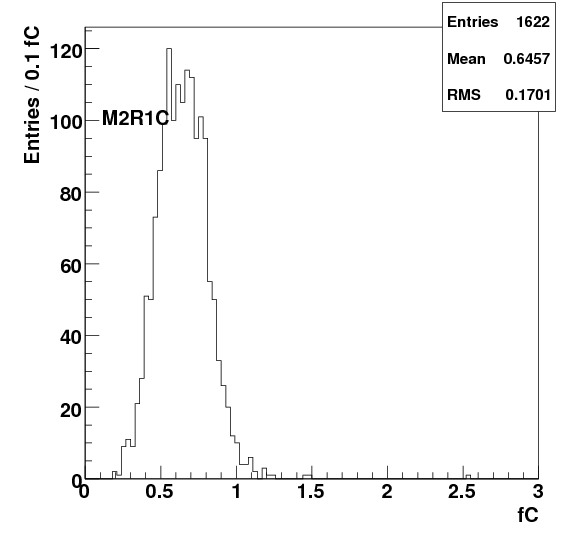
| M1R1 | - | M2R1 C; M2R1 W | 10; 15 | M3R1 C; M3R1W | 10; 14 | M4R1 | 15 | M5R1 | 15 |
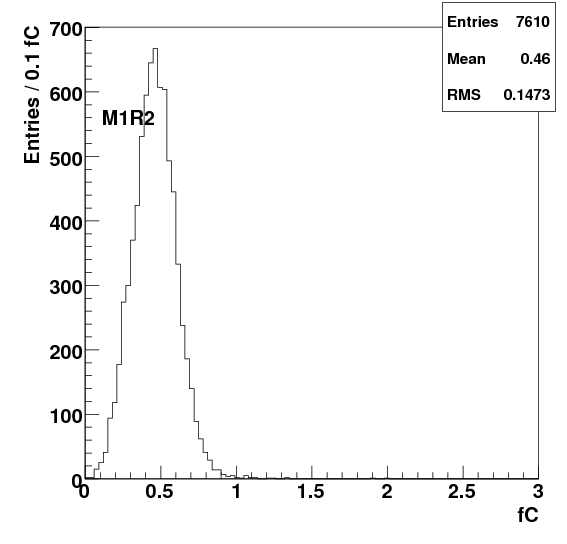
| M1R2 | 16 | M2R2 C; M2R2 W | 11; 14 | M3R2 C; M3R2 W | 11; 14 | M4R2 | 10.2 | M5R2 | 10 |
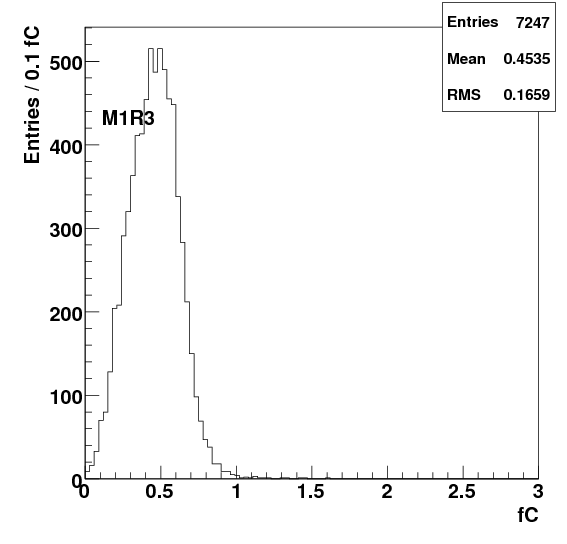
| M1R3 | 10 | M2R3 | 11.7 | M3R3 | 11.5 | M4R3 | 10.1 | M5R3 | 9.6 |
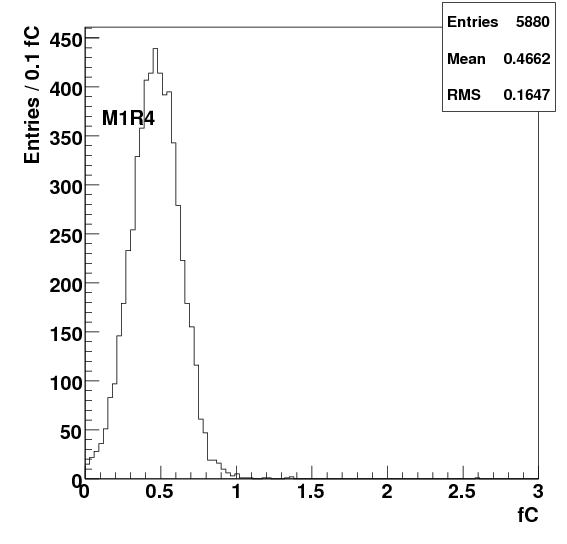
| M1R4 | 10.8 | M2R4 | 10 | M3R4 | 10 | M4R4 | 8.3 | M5R4 | 7 |


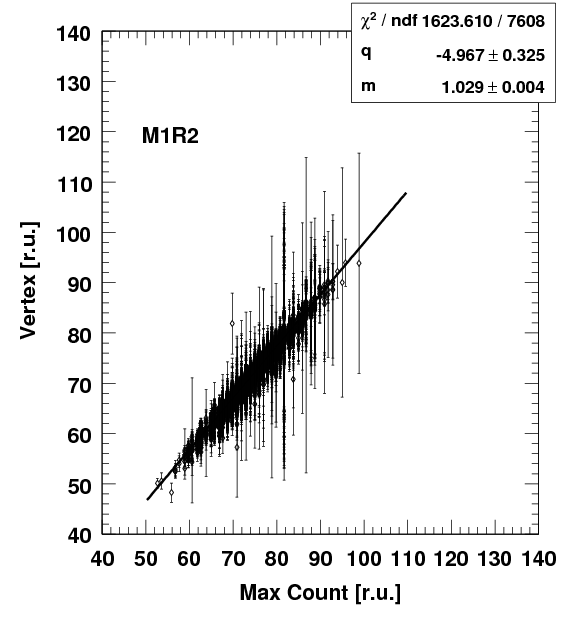
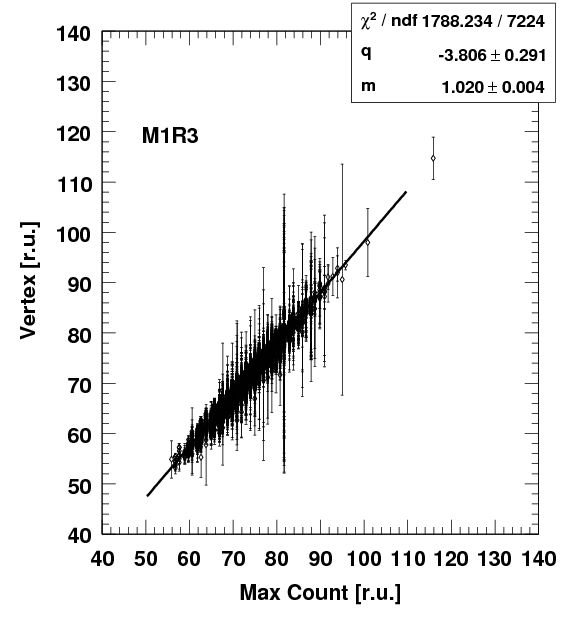
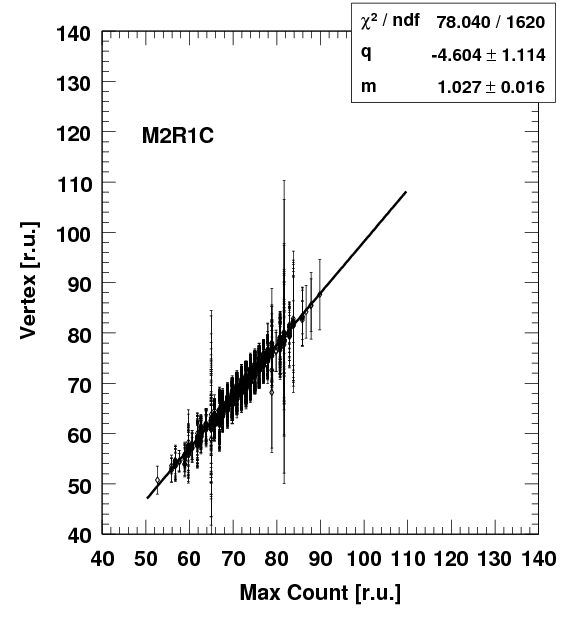
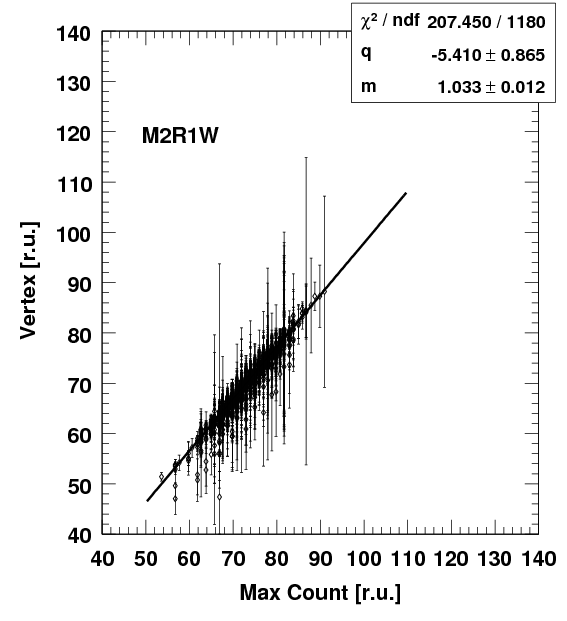
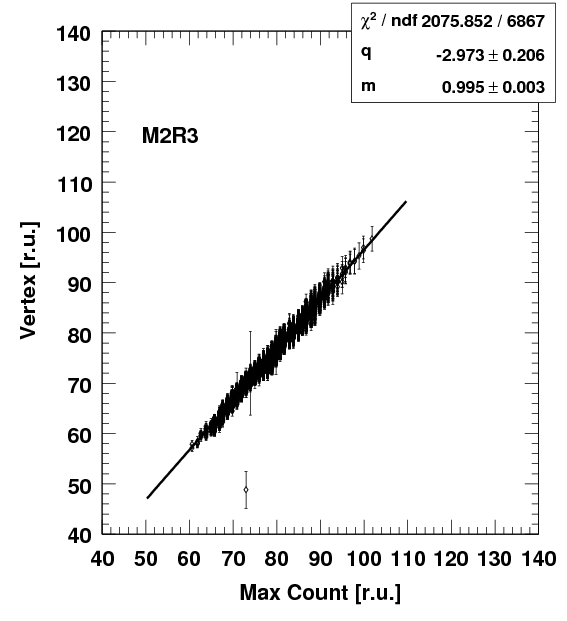
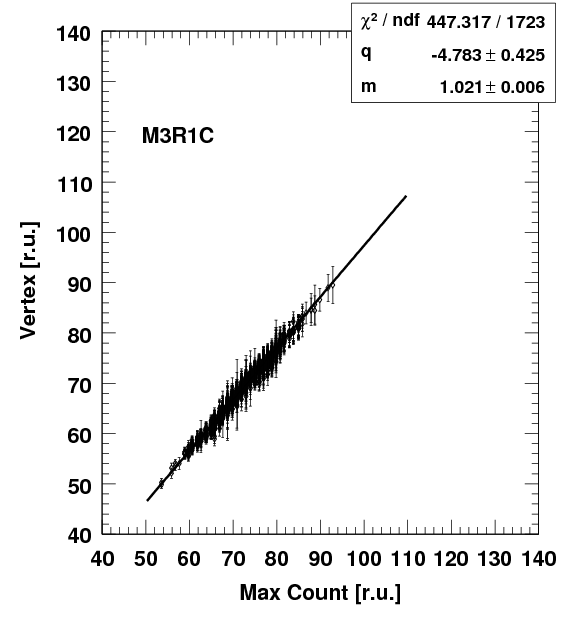
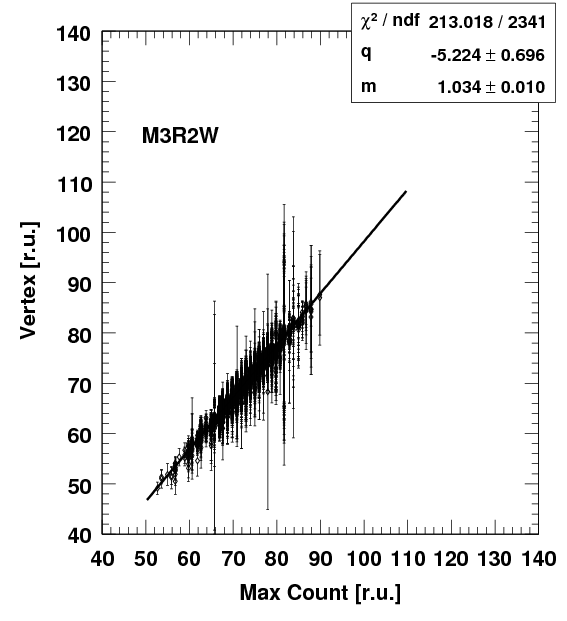
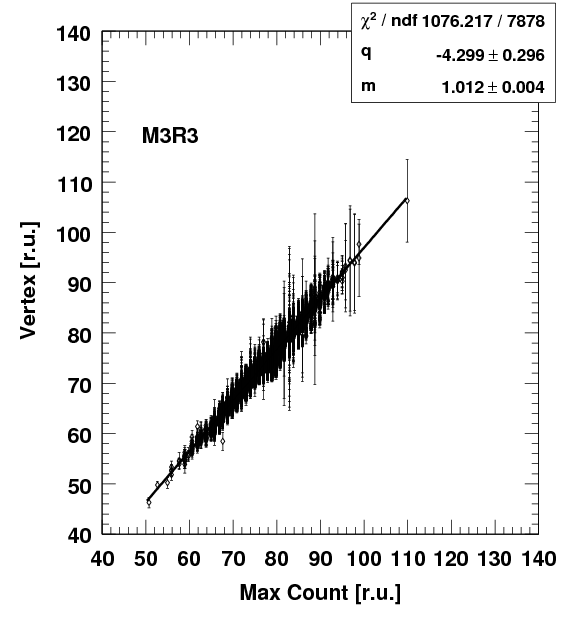
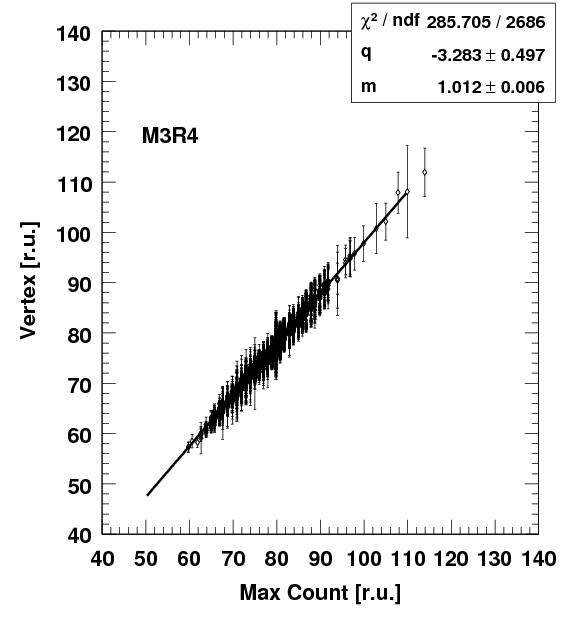
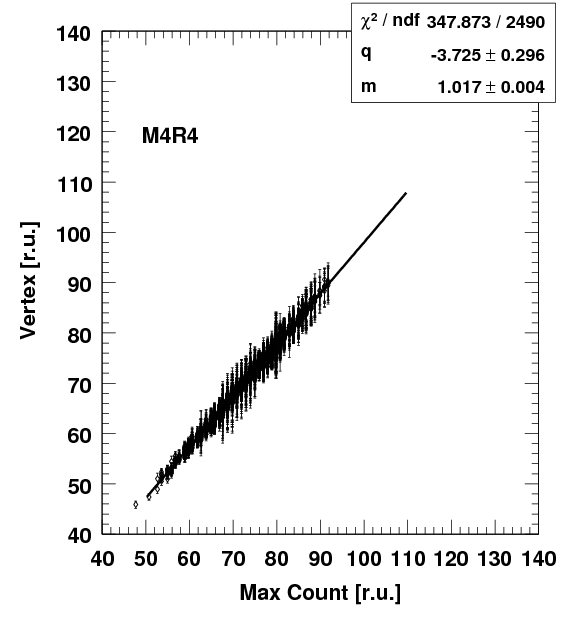
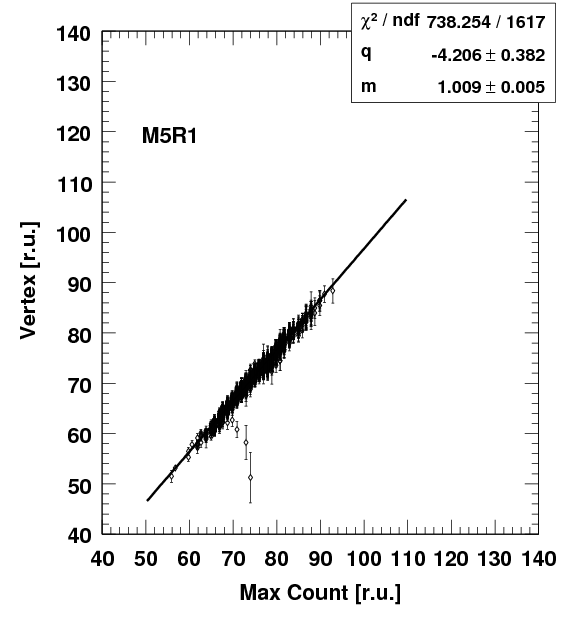
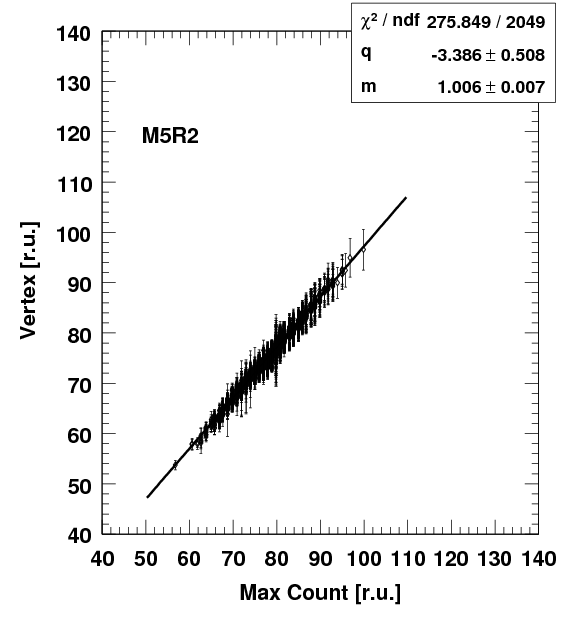
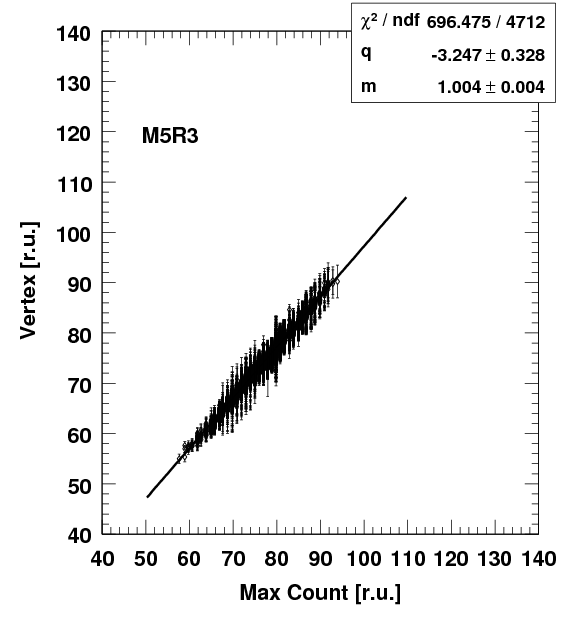
Scatter plots


Alessio Sarti
Last modified: Sat Dec 29 16:08:24 CET 2007