The decay rate contains two real functions
as the only unknowns. In Figs. (1.1,1.2) we display
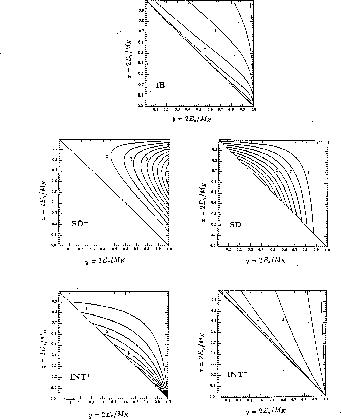
contour plots for the density distributions

 for
for  . These
five terms have obviously very different Dalitz plots. Therefore, in principle,
one can determine the strength of each term by choosing a suitable kinematical
region of observation. To pin down
  , it would be sufficient to
measure
at each photon energy the interference term INT
 . This has not yet

Figure 1.1: Contour plots for
 ,...,
,...,
 [
[ ]. The numbering on the
lines points towards increasing modulus. The normalization is arbitrary.

Figure 1.2: Contour plots for
 ,...,
,...,
 [
[ ]. The numbering on the
lines points towards increasing modulus. The normalization is arbitrary.
been achieved so far, either because the contribution of INT is too small (in
  )
, or because too few events have been collected (in
 ). On the other hand, from a
measurement
of SD
 alone one can determine A, V only up to a fourfold
ambiguity:
In terms of the ratio
this ambiguity amounts to
Therefore, in order to pin down the amplitudes A and V uniquely, one must
measure the interference terms INT as well.