In this section, the main results of our analysis are summarized.
These results have been obtained by varying the experimental quantities,
e.g. the value of the top mass  ,
,  , etc., and
the theoretical parameters, e.g. the B-parameters,
the strange quark mass
, etc., and
the theoretical parameters, e.g. the B-parameters,
the strange quark mass  , etc., according to their errors.
Values and errors of the input quantities used in the following are reported
in tables 2--4.
We assume a Gaussian distribution
for the experimental quantities and a flat distribution
(with a width of 2
, etc., according to their errors.
Values and errors of the input quantities used in the following are reported
in tables 2--4.
We assume a Gaussian distribution
for the experimental quantities and a flat distribution
(with a width of 2 ) for the theoretical ones.
The only exception is
) for the theoretical ones.
The only exception is  , taken from quenched lattice QCD calculations,
for which we have assumed a Gaussian distribution, according to the results
of ref. [32].
, taken from quenched lattice QCD calculations,
for which we have assumed a Gaussian distribution, according to the results
of ref. [32].
The theoretical predictions ( ,
,  , etc.)
depend on several fluctuating parameters. We have obtained their
distributions numerically,
from which we have calculated the central values and the errors
reported below.
, etc.)
depend on several fluctuating parameters. We have obtained their
distributions numerically,
from which we have calculated the central values and the errors
reported below.

Table: Values of the fluctuating parameters used in the numerical
analysis.
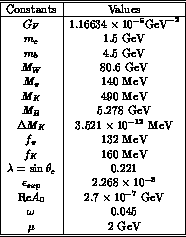
Table: Constants used in the numerical analysis.

Table: Values of the B-parameters, for operators renormalized at the
scale  GeV. The only exception is
  , which is the
renormalization group invariant B-parameter.
, which is the
renormalization group invariant B-parameter.  has been taken equal to
  , at any renormalization scale. The value reported
in the table is
, at any renormalization scale. The value reported
in the table is  GeV).
Entries with a
GeV).
Entries with a  are educated guesses, the others are taken from lattice QCD calculations.
Using the values given in the tables and the formulae given in the previous sections, we have obtained the following results:
 , obtained by comparing
the experimental value of
, obtained by comparing
the experimental value of  with its theoretical
prediction, is given in fig. 3. As already noticed in
refs. [7,8] and [20,21],
large values of
with its theoretical
prediction, is given in fig. 3. As already noticed in
refs. [7,8] and [20,21],
large values of  and
and  favour
  ,
given the current measurement of
,
given the current measurement of  . When the condition 160 MeV
 MeV is imposed (
 -cut),
most of the negative solutions disappear,
giving the dashed histogram of fig. 3, from which we estimate
-cut),
most of the negative solutions disappear,
giving the dashed histogram of fig. 3, from which we estimate

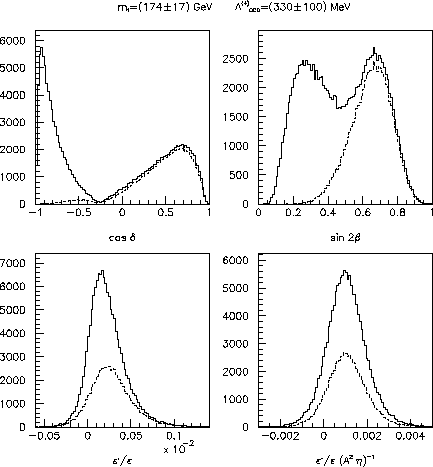
Figure: Distributions of values for  ,
,
 ,
,  and
and  ,
for
,
for  GeV,
using the values of the parameters given in tabs.
2--4. The solid histograms are obtained without
using the information coming from
GeV,
using the values of the parameters given in tabs.
2--4. The solid histograms are obtained without
using the information coming from  --
-- mixing. The dashed ones
use the
mixing. The dashed ones
use the  information, assuming that
160 MeV
information, assuming that
160 MeV  MeV.
MeV.
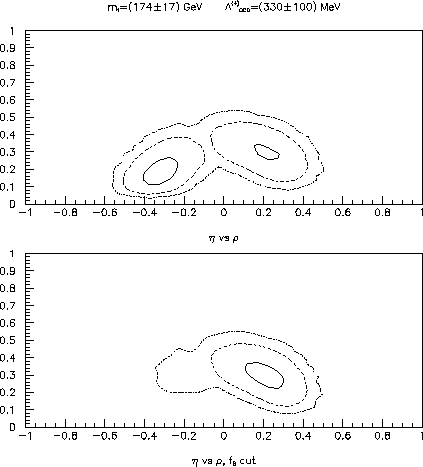
Figure: Contour plots in the  --
-- plane.
The solid, dashed and dotted contours contain
plane.
The solid, dashed and dotted contours contain
 ,
,  and
and  of the generated events respectively.
The contours are given by excluding or including the
of the generated events respectively.
The contours are given by excluding or including the
 -cut. Similar results can be found in refs. [20,21].
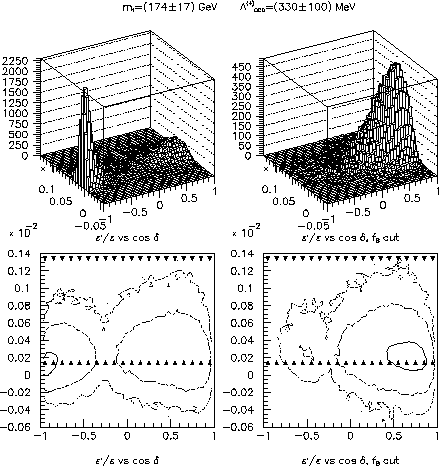
Figure: Distributions of the events in the
plane  --
-- without
and with the
without
and with the  -cut. The corresponding
contour plots are displayed below the Lego plots.
-cut. The corresponding
contour plots are displayed below the Lego plots.
 --
-- plane is
given in fig. 4. It shows the current limits on the
unitarity triangle defined in fig. 1.
plane is
given in fig. 4. It shows the current limits on the
unitarity triangle defined in fig. 1.
 are provided. Lego plots of the distribution of the generated
events in the
are provided. Lego plots of the distribution of the generated
events in the  --
-- plane are shown, without
and with the
plane are shown, without
and with the  -cut. In the same figure, the corresponding
contour plots are displayed. One notices a very mild dependence
of
-cut. In the same figure, the corresponding
contour plots are displayed. One notices a very mild dependence
of  on
on  . As a consequence, one obtains approximately
the same prediction in the two cases (see also fig. 3).
In the HV scheme the results are
. As a consequence, one obtains approximately
the same prediction in the two cases (see also fig. 3).
In the HV scheme the results are

and
whereas in the NDR scheme we obtain

and
By averaging the results given in eqs. (75) and (77), we obtain our best estimate

where the third error comes from the difference of the central values in the two schemes and gives an estimate of the uncertainty due to higher-order corrections.
A similar result has been obtained in ref. [14], using a different approach to the hadronic-matrix-element evaluation. They quote

for  GeV. For this value of the top mass, the cancellation between
penguin and electropenguin contributions is less effective, thus their
GeV. For this value of the top mass, the cancellation between
penguin and electropenguin contributions is less effective, thus their
 prediction is significantly larger than ours. Actually the two
predictions agree, once the difference in the top mass is
taken into account
prediction is significantly larger than ours. Actually the two
predictions agree, once the difference in the top mass is
taken into account![]() .
It is reassuring that theoretical predictions, obtained by using quite
different approaches to matrix elements evaluation, are in good agreement.
.
It is reassuring that theoretical predictions, obtained by using quite
different approaches to matrix elements evaluation, are in good agreement.
On the basis of the latest analyses, it seems very difficult
that  is larger than
  .
Theoretically, this may happen by taking the matrix elements of the
dominant operators,
.
Theoretically, this may happen by taking the matrix elements of the
dominant operators,  and
and  , much more different than
it is usually assumed.
One possibility, discussed in ref. [14], is to take
, much more different than
it is usually assumed.
One possibility, discussed in ref. [14], is to take
 and
and  , instead of the usual values
 .
To our knowledge, no coherent theoretical approach can accommodate
such large values of
.
To our knowledge, no coherent theoretical approach can accommodate
such large values of  .
.

