|
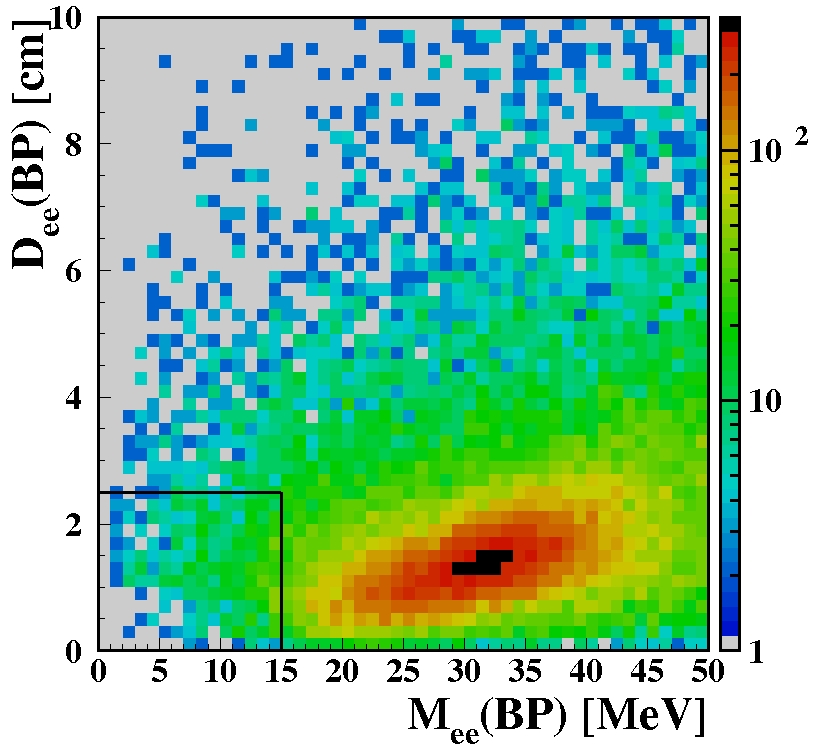
D_ee vs M_ee evaluated at the beam pipe for MC signal.
Events in the box M_ee(BP).lt.15 MeV and D_ee(BP).lt.2.5 cm are
rejected.
|
|
color eps
|
|
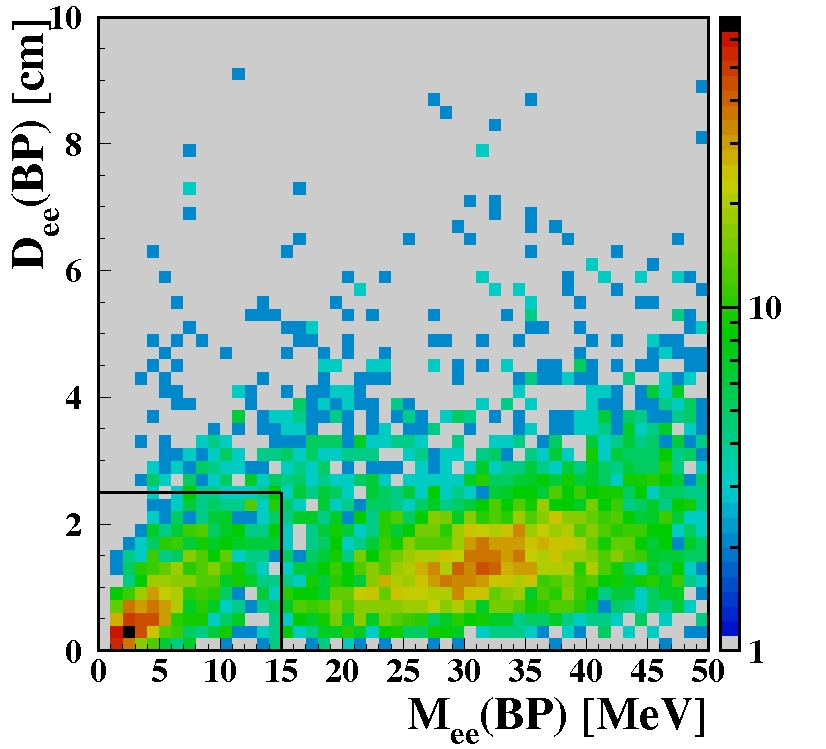
D_ee vs M_ee evaluated at the beam pipe for $\phi$ background.
Events in the box M_ee(BP).lt.15 MeV and D_ee(BP).lt.2.5 cm are
rejected.
|
|
color eps
|
|
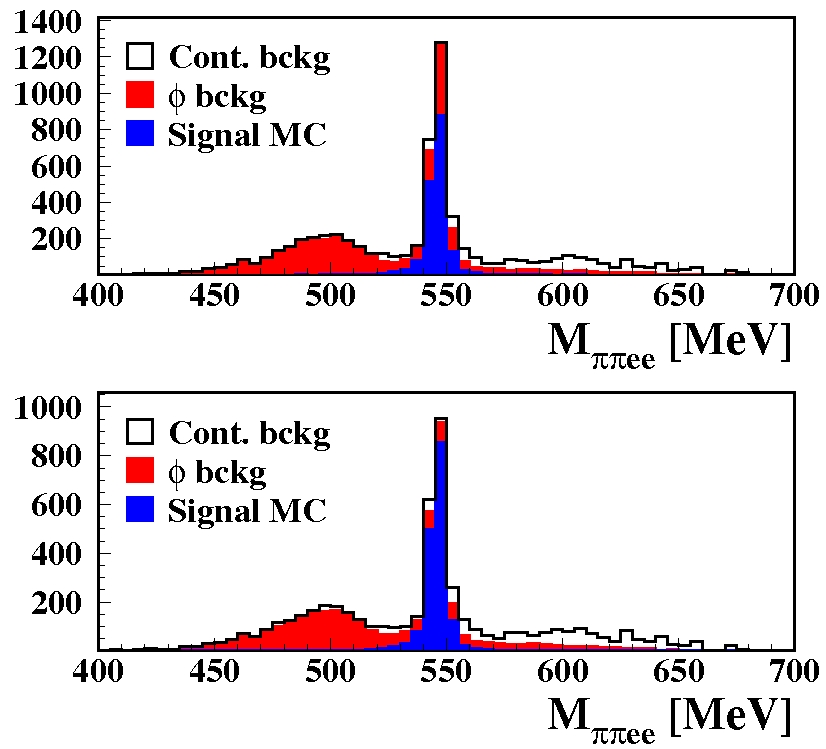
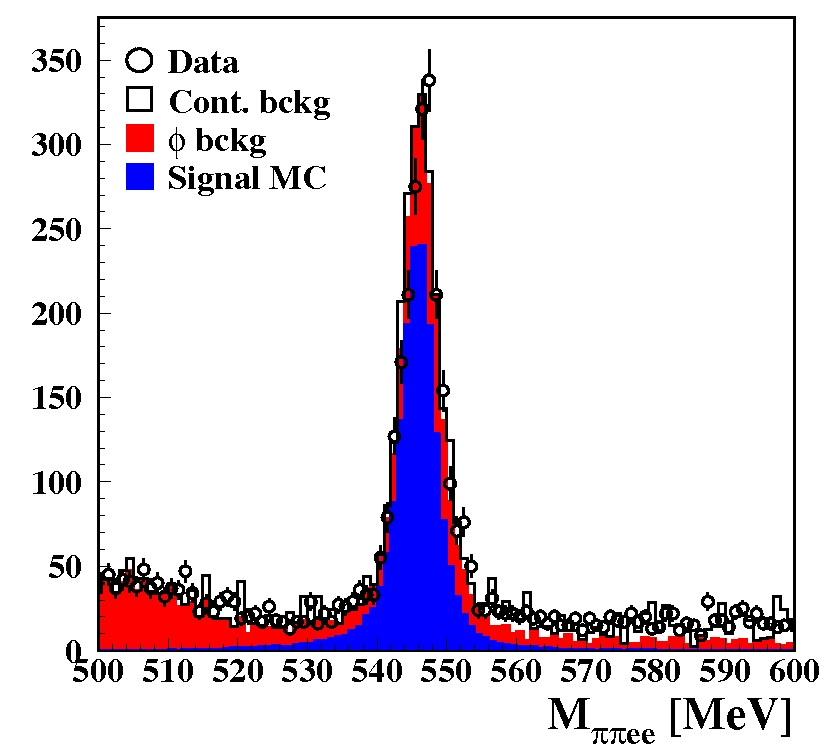
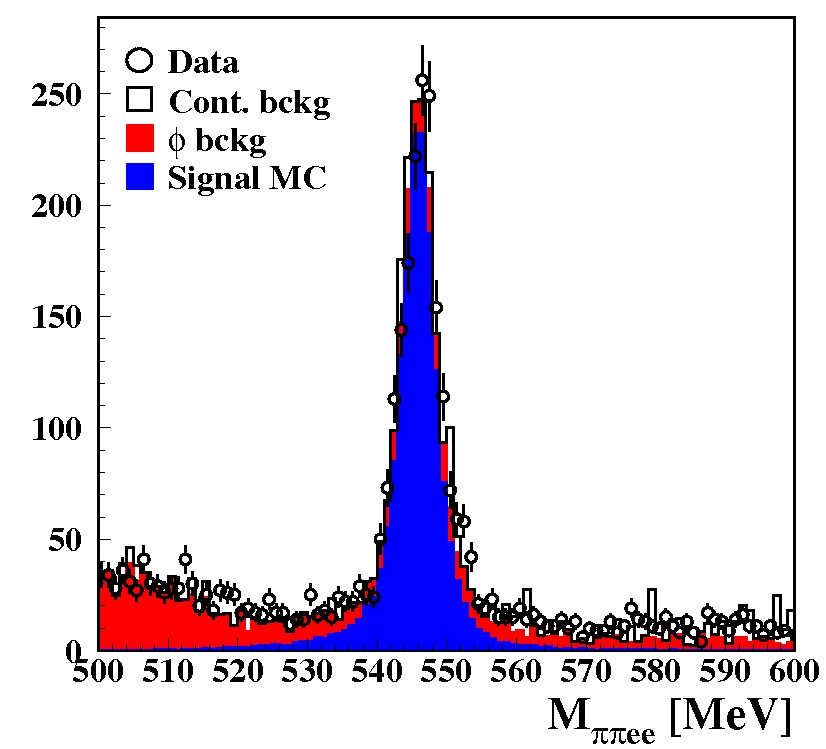
Spectrum of the pipiee invariant mass after the cuts on the
momenta (top panel) and after the cut to reject events with
photon conversions (bottom panel) have been applied.
The black histogram is the expected distribution, i.e. signal MC
(dark grey), $\phi$ background (light grey) and continuum
background (white).
The three samples have been normalized according to their
luminosity.
|
|
color eps
|
|
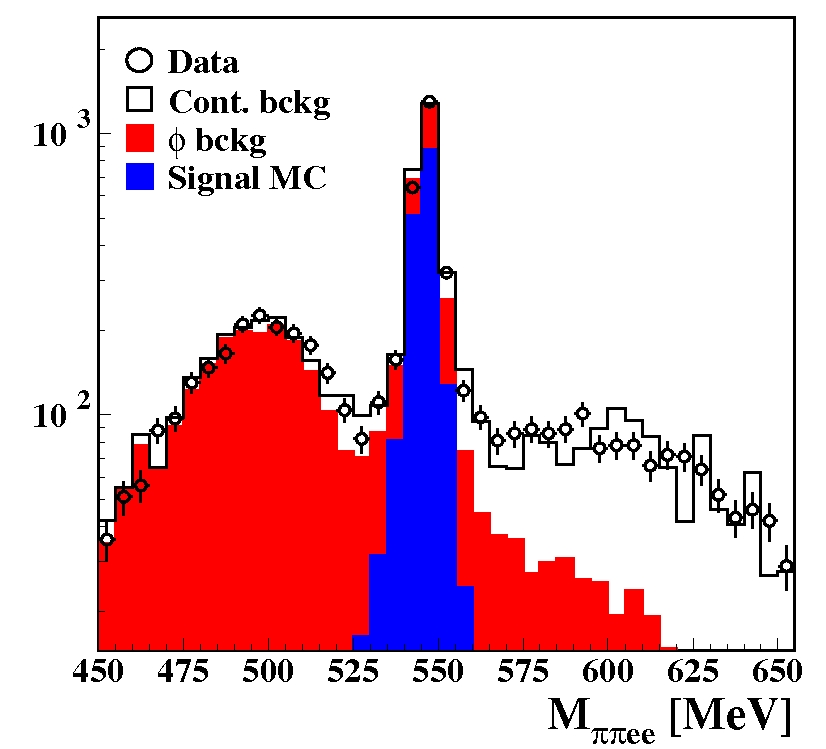
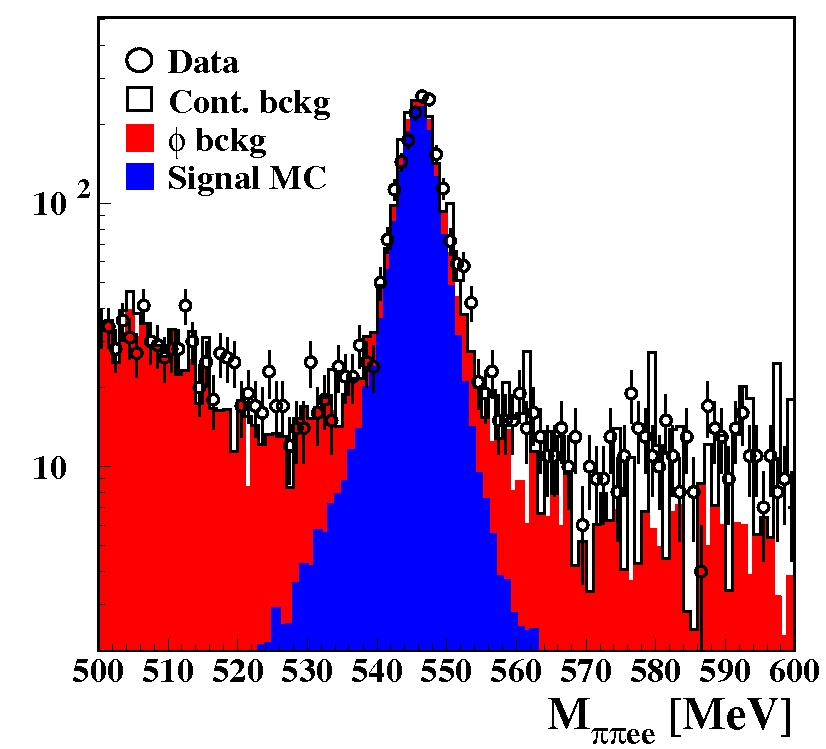
$\ppee$ invariant mass spectrum on a wide range
AFTER THE FIT.
The background scale factors have been obtained as described in
section \ref{sec:fit-invmass}.
Dots: data.
The black histogram is the expected distribution, i.e. signal MC
(dark grey), $\phi$ background (light grey) and continuum
background (white).
|
|
color eps
|
|
$\ppee$ invariant mass spectrum
zoomed around the $\eta$ mass AFTER THE FIT.
The background scale factors have been obtained as described in
section \ref{sec:fit-invmass}.
Dots: data.
The black histogram is the expected distribution, i.e. signal MC
(dark grey), $\phi$ background (light grey) and continuum
background (white).
|
|
color eps
|
|
$\ppee$ invariant mass spectrum
zoomed around the $\eta$ mass AFTER ALL CUTS but the
one on the $\ppee$ invariant mass itself.
The background scale factors have been obtained as described in
section \ref{sec:fit-invmass}.
Dots: data.
The black histogram is the expected distribution, i.e. signal MC
(dark grey), $\phi$ background (light grey) and continuum
background (white).
|
|
color eps
|
|
Opening angle for the $\ee$ pair for events in the signal region.
The background scale factors have been obtained as described in
section \ref{sec:fit-invmass}.
Dots: data.
The black histogram is the expected distribution, i.e. signal MC
(dark grey), $\phi$ background (light grey) and continuum
background (white).
|
|
color eps
|
|
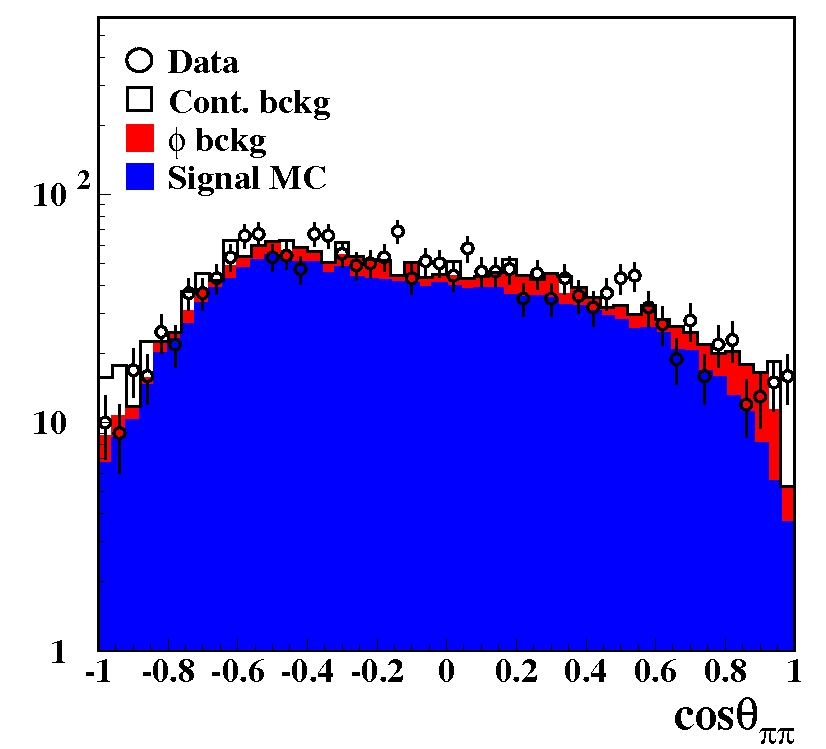
Opening angle for the $\pp$ pair for events in the signal region.
The background scale factors have been obtained as described in
section \ref{sec:fit-invmass}.
Dots: data.
The black histogram is the expected distribution, i.e. signal MC
(dark grey), $\phi$ background (light grey) and continuum
background (white).
|
|
color eps
|
|
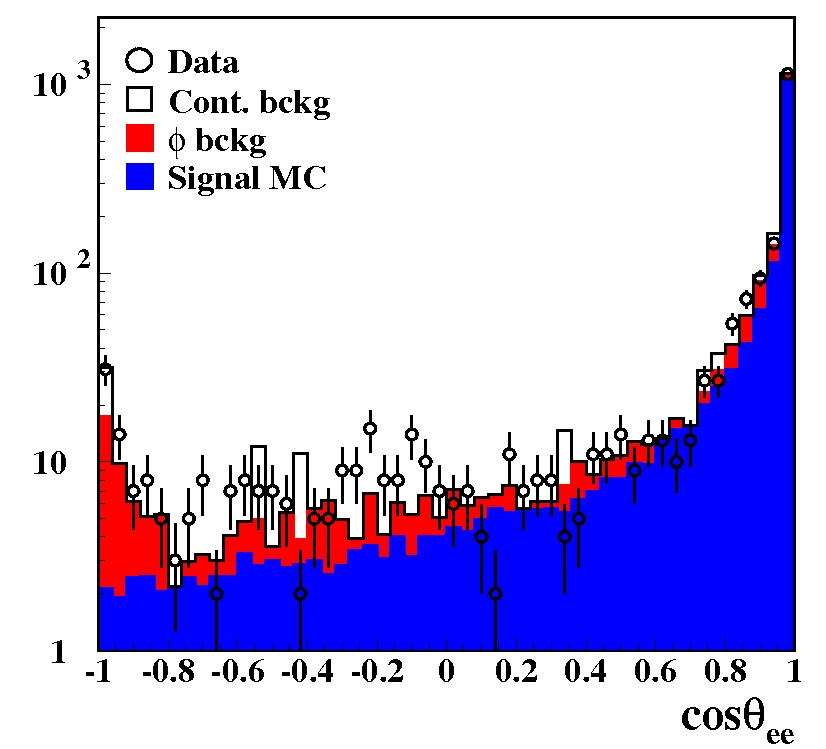
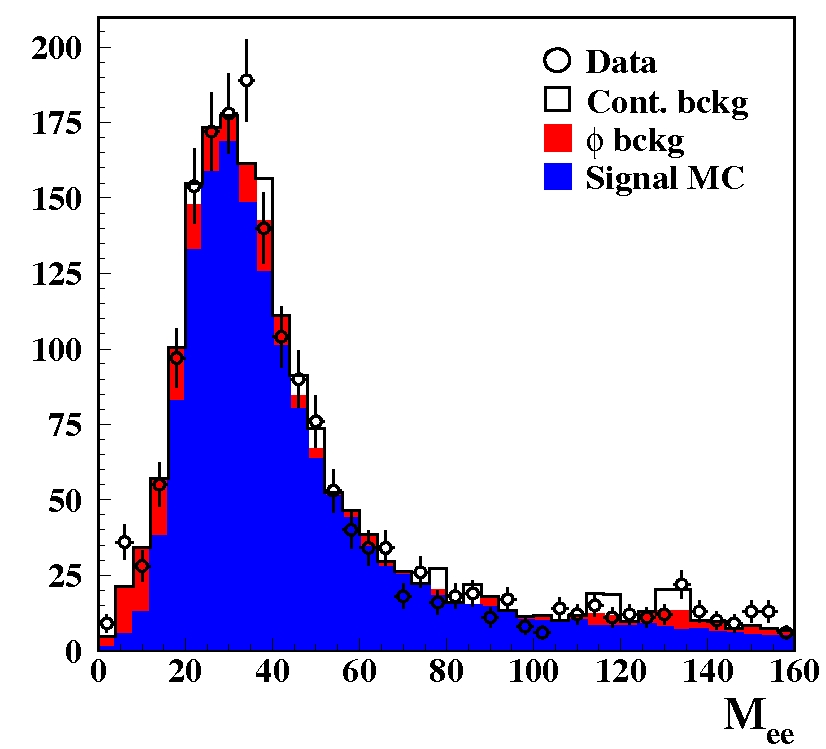
Invariant mass of the $\ee$ pair for events in the signal region.
The background scale factors have been obtained as described in
section \ref{sec:fit-invmass}.
Dots: data.
The black histogram is the expected distribution, i.e. signal MC
(dark grey), $\phi$ background (light grey) and continuum
background (white).
|
|
color eps
|
|
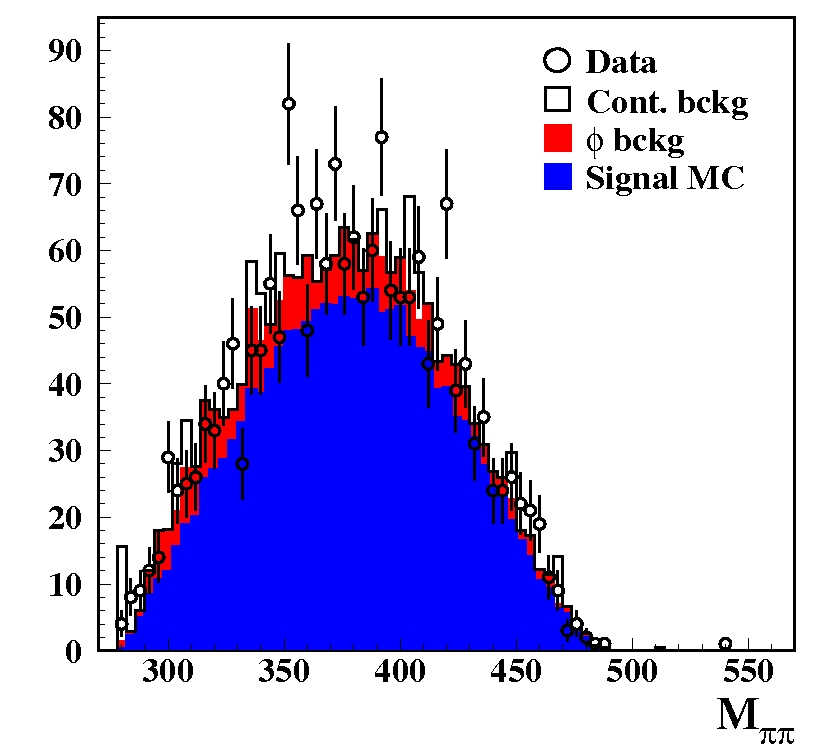
Invariant mass of the $\pp$ pair for events in the signal region.
The background scale factors have been obtained as described in
section \ref{sec:fit-invmass}.
Dots: data.
The black histogram is the expected distribution, i.e. signal MC
(dark grey), $\phi$ background (light grey) and continuum
background (white).
|
|
color eps
|
|
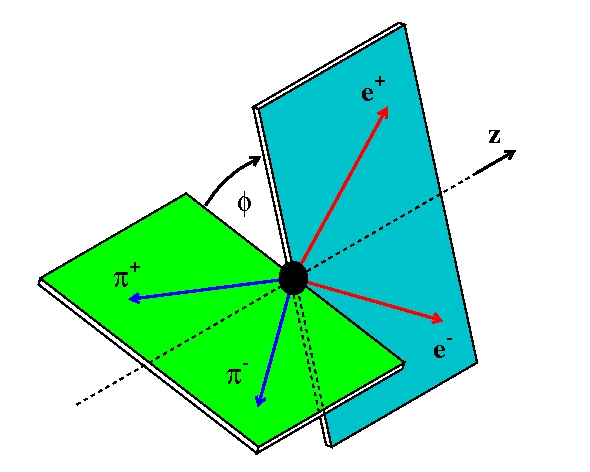
Definition of the angle $\phi$ between the pion and electron
decay planes.
|
|
color eps
|
|
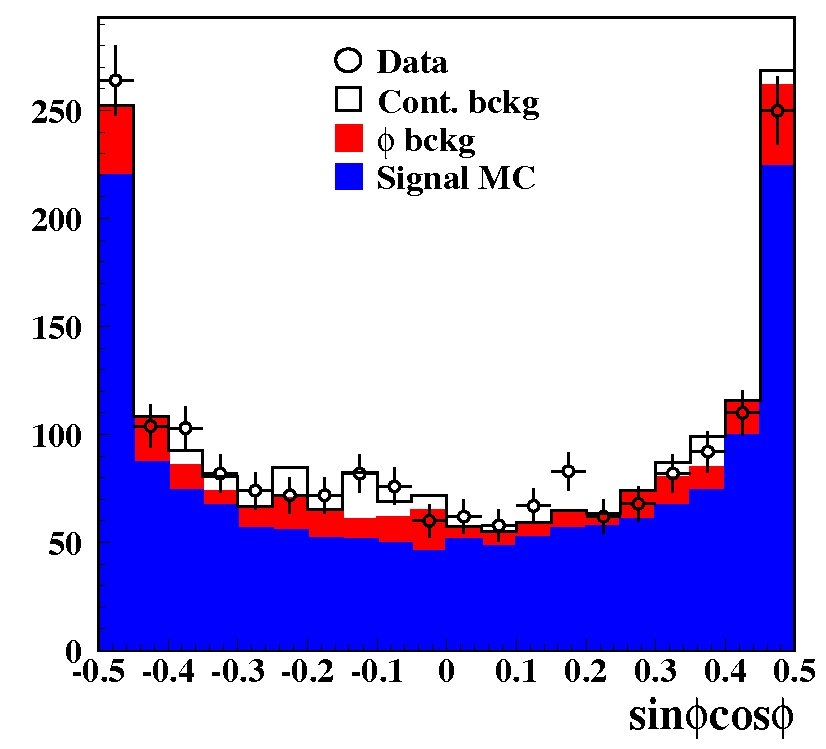
Distribution of the $\spcp$ variable in the signal region.
The background scale factors have been obtained as described in
section \ref{sec:fit-invmass}.
Dots: data.
The black histogram is the expected distribution, i.e. signal MC
(dark grey), $\phi$ background (light grey) and continuum
background (white).
|
|
color eps
|
|
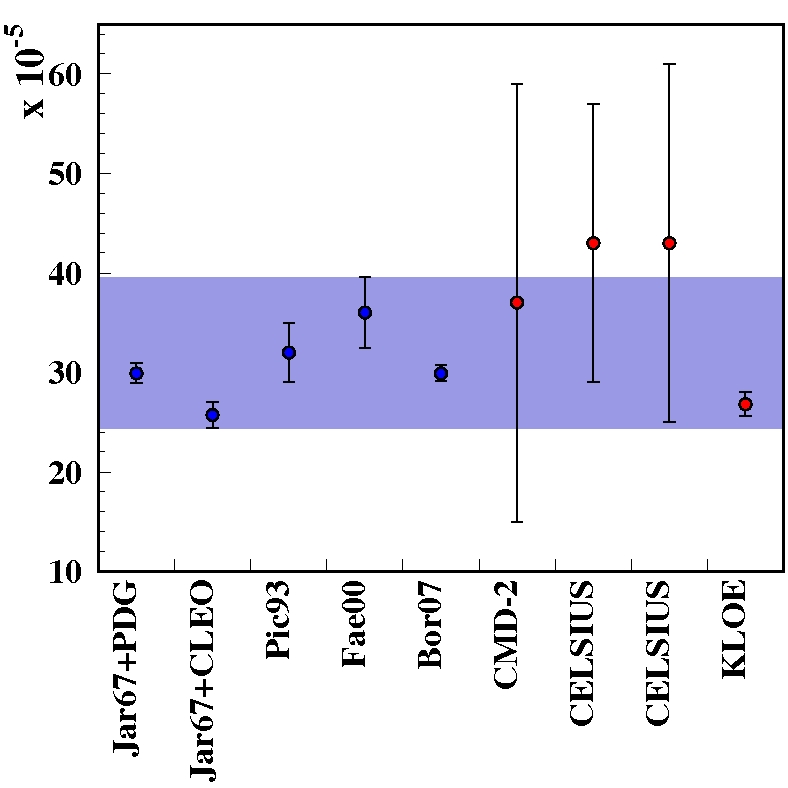
Comparison between theoretical prediction and experimental
measurements of the branching ratio.
The band spans between the lower theoretical prediction -1 sigma
(Jarlskog et al.) and the maximum theoretical prediction +1 sigma
(Faessleret al., where the error is not explicitly quoted and has
been evaluated [by us] about 10% of the central value).
|
|
color eps
|