|
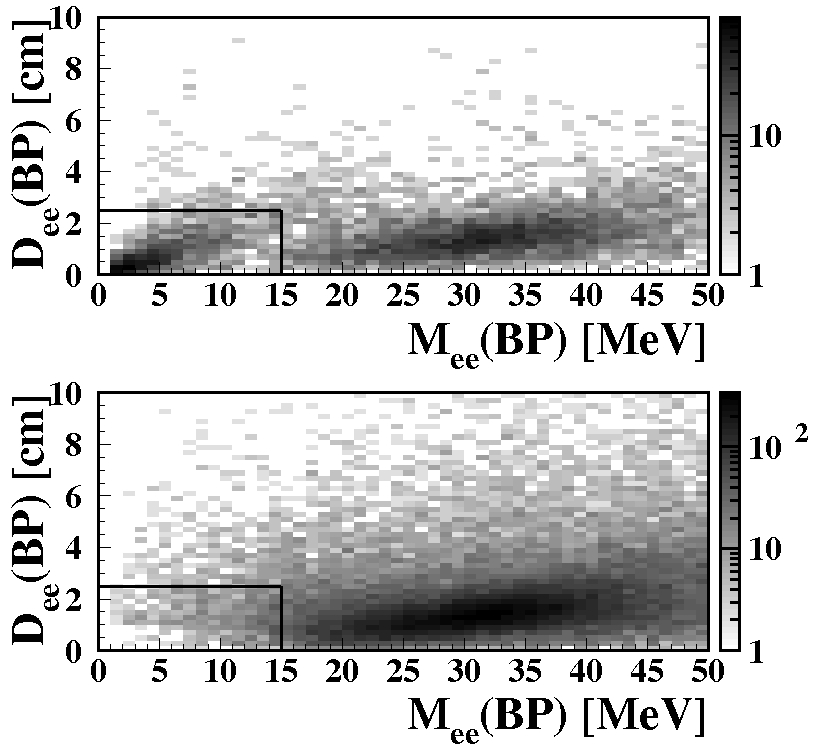
D_ee vs M_ee evaluated at the beam pipe for phi background (top
panel) and MC signal (bottom panel).
Events in the box M_ee(BP).lt.15 MeV and D_ee(BP).lt.2.5 cm are
rejected.
|
|
bw eps
|
|
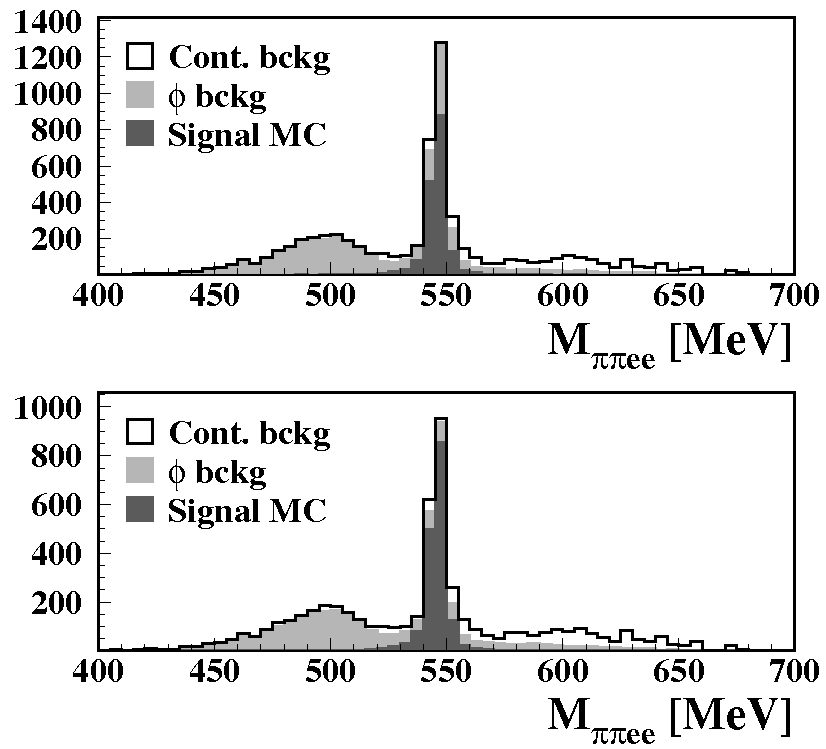
Spectrum of the pipiee invariant mass after the cuts on the
momenta (top panel) and after the cut to reject events with
photon conversions (bottom panel) have been applied.
The black histogram is the expected distribution, i.e. signal MC
(dark grey), $\phi$ background (light grey) and continuum
background (white).
The three samples have been normalized according to their
luminosity.
|
|
bw eps
|
|
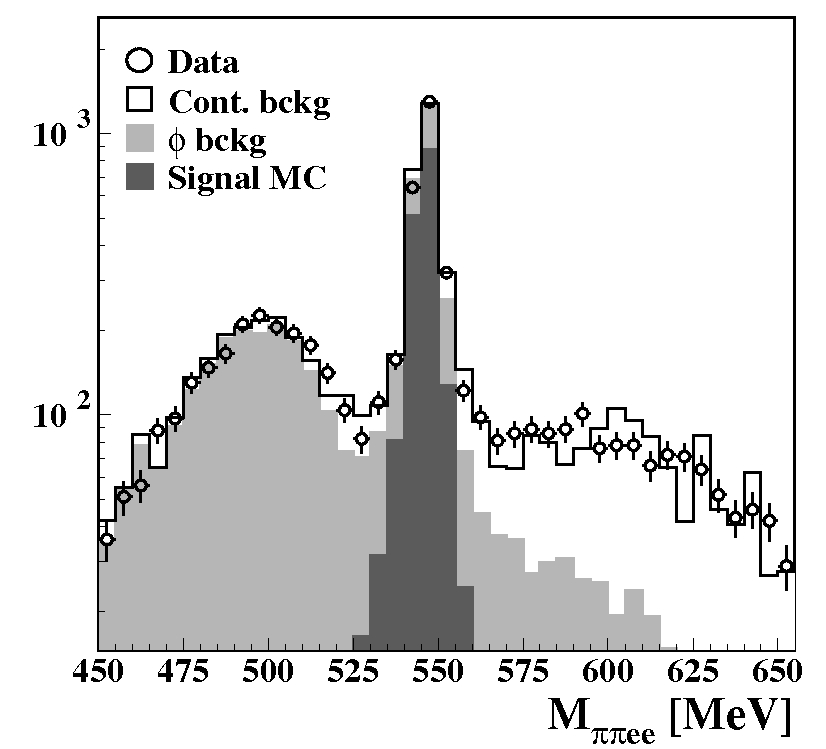
$\ppee$ invariant mass spectrum on a wide range.
The background scale factors have been obtained as described in
section \ref{sec:fit-invmass}.
Dots: data.
The black histogram is the expected distribution, i.e. signal MC
(dark grey), $\phi$ background (light grey) and continuum
background (white).
|
|
bw eps
|
|
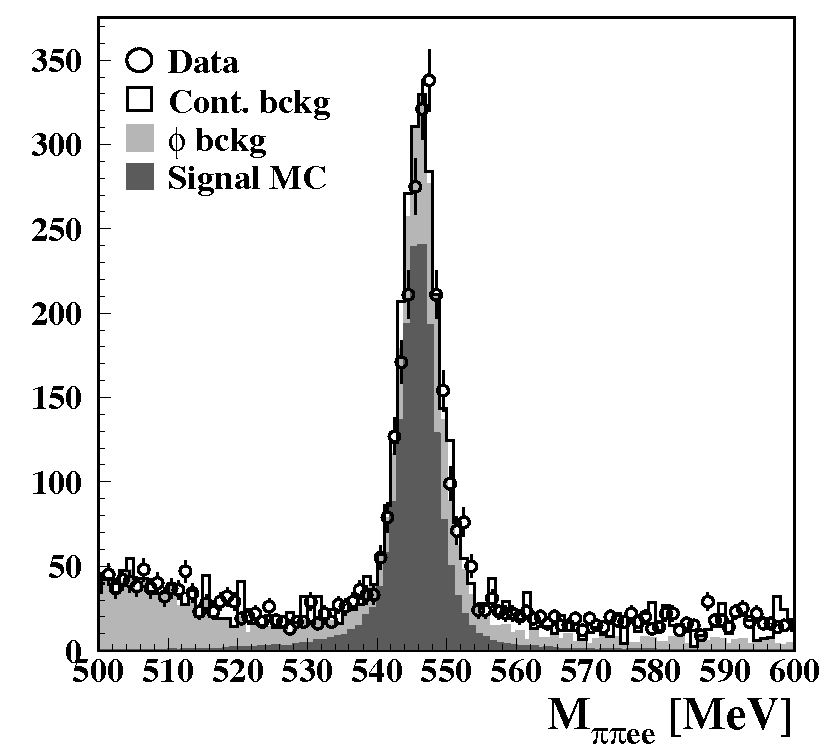
$\ppee$ invariant mass spectrum
zoomed around the $\eta$ mass (right panel).
The background scale factors have been obtained as described in
section \ref{sec:fit-invmass}.
Dots: data.
The black histogram is the expected distribution, i.e. signal MC
(dark grey), $\phi$ background (light grey) and continuum
background (white).
|
|
bw eps
|
|
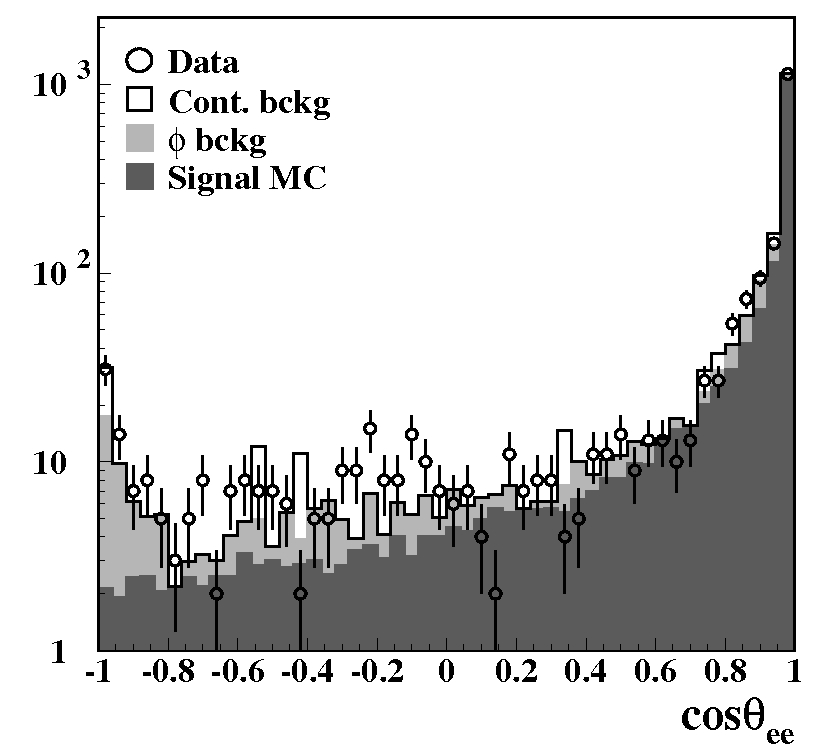
Opening angle for the $\ee$ pair for events in the signal region.
The background scale factors have been obtained as described in
section \ref{sec:fit-invmass}.
Dots: data.
The black histogram is the expected distribution, i.e. signal MC
(dark grey), $\phi$ background (light grey) and continuum
background (white).
|
|
bw eps
|
|
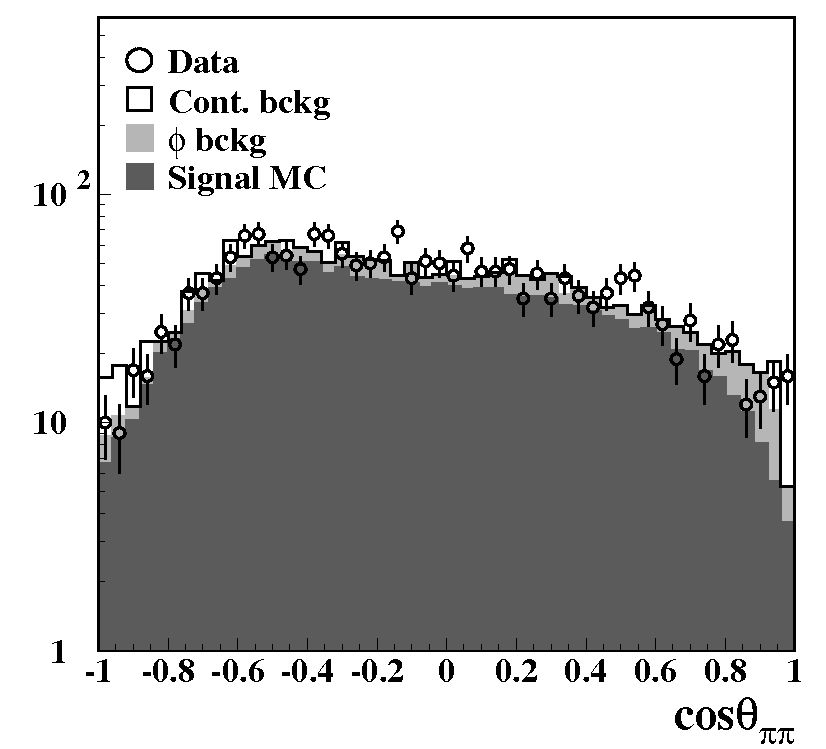
Opening angle for the $\pp$ pair for events in the signal region.
The background scale factors have been obtained as described in
section \ref{sec:fit-invmass}.
Dots: data.
The black histogram is the expected distribution, i.e. signal MC
(dark grey), $\phi$ background (light grey) and continuum
background (white).
|
|
bw eps
|
|
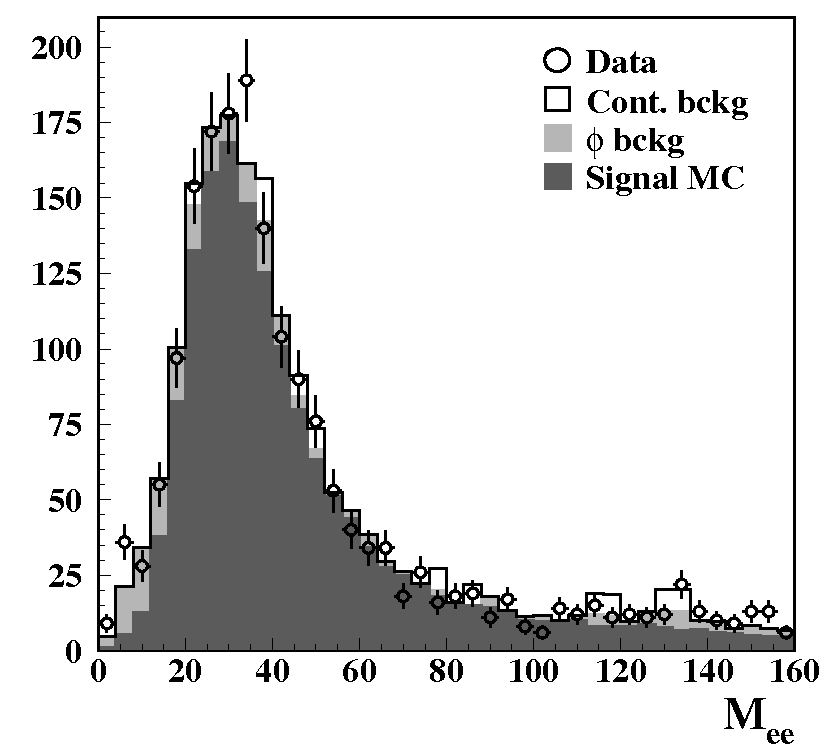
Invariant mass of the $\ee$ pair for events in the signal region.
The background scale factors have been obtained as described in
section \ref{sec:fit-invmass}.
Dots: data.
The black histogram is the expected distribution, i.e. signal MC
(dark grey), $\phi$ background (light grey) and continuum
background (white).
|
|
bw eps
|
|
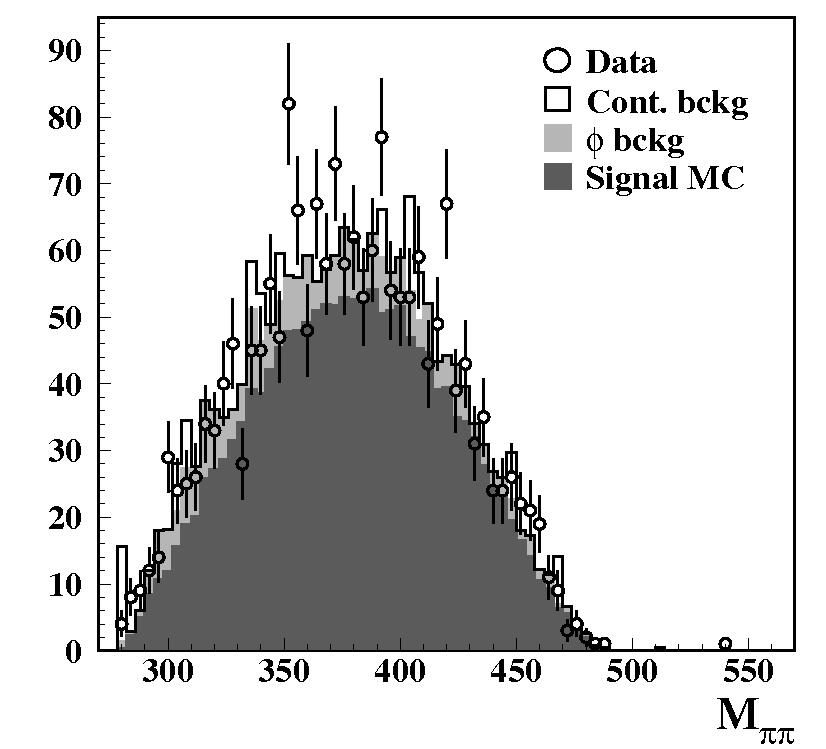
Invariant mass of the $\pp$ pair for events in the signal region.
The background scale factors have been obtained as described in
section \ref{sec:fit-invmass}.
Dots: data.
The black histogram is the expected distribution, i.e. signal MC
(dark grey), $\phi$ background (light grey) and continuum
background (white).
|
|
bw eps
|
|
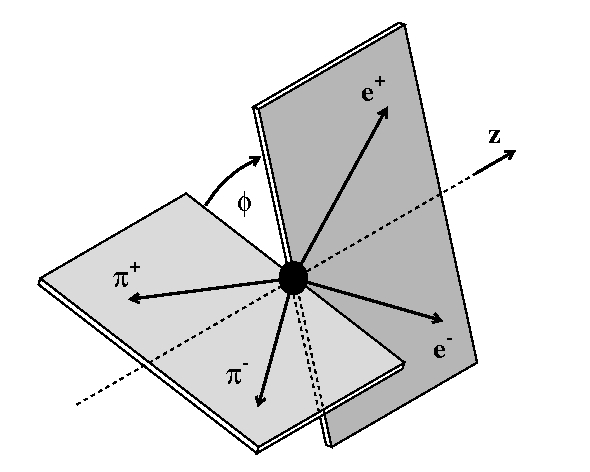
Definition of the angle $\phi$ between the pion and electron
decay planes.
|
|
bw eps
|
|
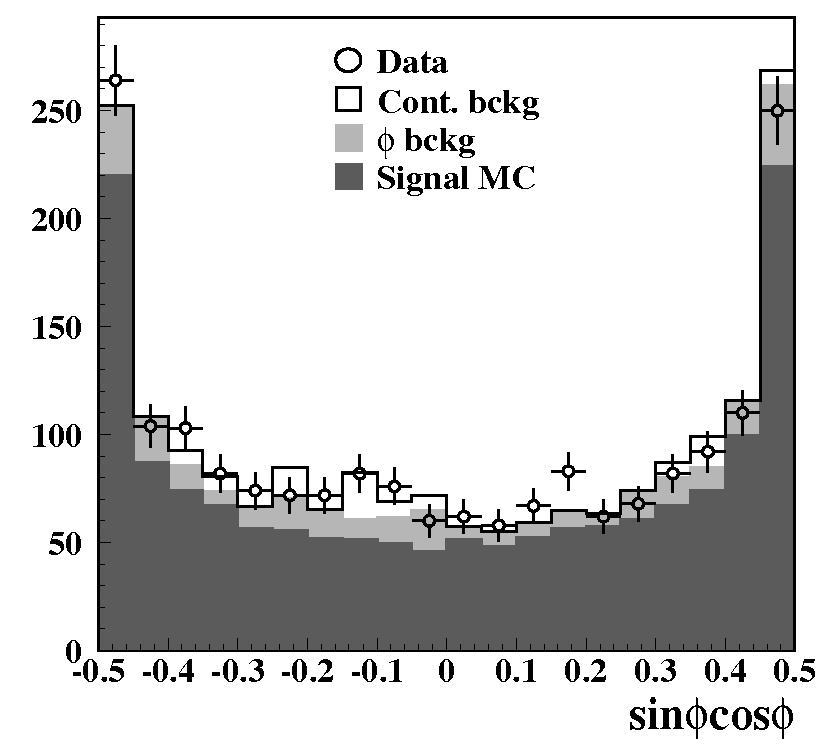
Distribution of the $\spcp$ variable in the signal region.
The background scale factors have been obtained as described in
section \ref{sec:fit-invmass}.
Dots: data.
The black histogram is the expected distribution, i.e. signal MC
(dark grey), $\phi$ background (light grey) and continuum
background (white).}
|
|
bw eps
|